
 Yahoo Finance
 Ambertech (ASX:AMO) Shareholders Will Want The ROCE Trajectory To Continue
If we want to find a potential multi-bagger, often there are underlying trends that can provide clues. Ideally, a business will show two trends; firstly a growing return on capital employed (ROCE) and secondly, an increasing amount of capital employed. This shows us that it's a compounding machine, able to continually reinvest its earnings back into the business and generate higher returns. So when we looked at Ambertech (ASX:AMO) and its trend of ROCE, we really liked what we saw.
What Is Return On Capital Employed (ROCE)?
For those that aren't sure what ROCE is, it measures the amount of pre-tax profits a company can generate from the capital employed in its business. Analysts use this formula to calculate it for Ambertech:
Return on Capital Employed = Earnings Before Interest and Tax (EBIT) ÷ (Total Assets - Current Liabilities)
0.13 = AU$3.8m ÷ (AU$52m - AU$23m) (Based on the trailing twelve months to June 2023).
Therefore, Ambertech has an ROCE of 13%. In absolute terms, that's a pretty normal return, and it's somewhat close to the Electronic industry average of 16%.
Check out our latest analysis for Ambertech
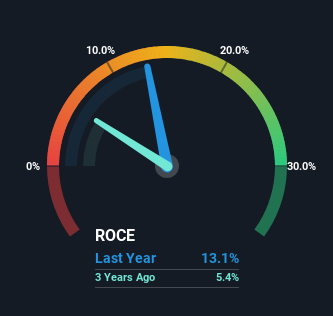
Historical performance is a great place to start when researching a stock so above you can see the gauge for Ambertech's ROCE against it's prior returns. If you want to delve into the historical earnings, revenue and cash flow of Ambertech, check out these free graphs here.
The Trend Of ROCE
The trends we've noticed at Ambertech are quite reassuring. Over the last five years, returns on capital employed have risen substantially to 13%. Basically the business is earning more per dollar of capital invested and in addition to that, 186% more capital is being employed now too. So we're very much inspired by what we're seeing at Ambertech thanks to its ability to profitably reinvest capital.
In another part of our analysis, we noticed that the company's ratio of current liabilities to total assets decreased to 44%, which broadly means the business is relying less on its suppliers or short-term creditors to fund its operations. So shareholders would be pleased that the growth in returns has mostly come from underlying business performance. Nevertheless, there are some potential risks the company is bearing with current liabilities that high, so just keep that in mind.
What We Can Learn From Ambertech's ROCE
All in all, it's terrific to see that Ambertech is reaping the rewards from prior investments and is growing its capital base. Since the stock has returned a staggering 112% to shareholders over the last five years, it looks like investors are recognizing these changes. With that being said, we still think the promising fundamentals mean the company deserves some further due diligence.
One more thing to note, we've identified 4 warning signs with Ambertech and understanding these should be part of your investment process.
For those who like to invest in solid companies, check out this free list of companies with solid balance sheets and high returns on equity.
Have feedback on this article? Concerned about the content? Get in touch with us directly. Alternatively, email editorial-team (at) simplywallst.com.
This article by Simply Wall St is general in nature. We provide commentary based on historical data and analyst forecasts only using an unbiased methodology and our articles are not intended to be financial advice. It does not constitute a recommendation to buy or sell any stock, and does not take account of your objectives, or your financial situation. We aim to bring you long-term focused analysis driven by fundamental data. Note that our analysis may not factor in the latest price-sensitive company announcements or qualitative material. Simply Wall St has no position in any stocks mentioned.
