
 Yahoo Finance
 The Altium (ASX:ALU) Share Price Is Up 949% And Shareholders Are Delighted

Long term investing can be life changing when you buy and hold the truly great businesses. And highest quality companies can see their share prices grow by huge amounts. For example, the Altium Limited (ASX:ALU) share price is up a whopping 949% in the last half decade, a handsome return for long term holders. And this is just one example of the epic gains achieved by some long term investors. In the last week the share price is up 1.7%.
It really delights us to see such great share price performance for investors.
View our latest analysis for Altium
There is no denying that markets are sometimes efficient, but prices do not always reflect underlying business performance. One imperfect but simple way to consider how the market perception of a company has shifted is to compare the change in the earnings per share (EPS) with the share price movement.
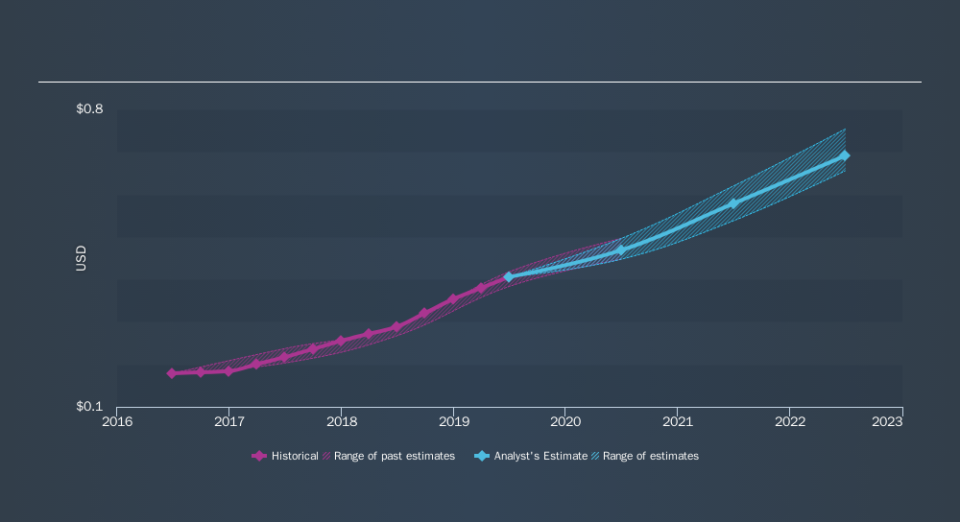
Over half a decade, Altium managed to grow its earnings per share at 32% a year. This EPS growth is slower than the share price growth of 60% per year, over the same period. This suggests that market participants hold the company in higher regard, these days. And that's hardly shocking given the track record of growth. This favorable sentiment is reflected in its (fairly optimistic) P/E ratio of 54.94.
You can see how EPS has changed over time in the image below (click on the chart to see the exact values).
We know that Altium has improved its bottom line over the last three years, but what does the future have in store? Take a more thorough look at Altium's financial health with this free report on its balance sheet.
What About Dividends?
As well as measuring the share price return, investors should also consider the total shareholder return (TSR). The TSR is a return calculation that accounts for the value of cash dividends (assuming that any dividend received was reinvested) and the calculated value of any discounted capital raisings and spin-offs. So for companies that pay a generous dividend, the TSR is often a lot higher than the share price return. As it happens, Altium's TSR for the last 5 years was 1075%, which exceeds the share price return mentioned earlier. This is largely a result of its dividend payments!
A Different Perspective
We're pleased to report that Altium shareholders have received a total shareholder return of 43% over one year. And that does include the dividend. However, the TSR over five years, coming in at 64% per year, is even more impressive. The pessimistic view would be that be that the stock has its best days behind it, but on the other hand the price might simply be moderating while the business itself continues to execute. Before spending more time on Altium it might be wise to click here to see if insiders have been buying or selling shares.
But note: Altium may not be the best stock to buy. So take a peek at this free list of interesting companies with past earnings growth (and further growth forecast).
Please note, the market returns quoted in this article reflect the market weighted average returns of stocks that currently trade on AU exchanges.
We aim to bring you long-term focused research analysis driven by fundamental data. Note that our analysis may not factor in the latest price-sensitive company announcements or qualitative material.
If you spot an error that warrants correction, please contact the editor at editorial-team@simplywallst.com. This article by Simply Wall St is general in nature. It does not constitute a recommendation to buy or sell any stock, and does not take account of your objectives, or your financial situation. Simply Wall St has no position in the stocks mentioned. Thank you for reading.