
 Yahoo Finance
 Alexandria (ARE) Q1 FFO Tops on Rent Growth, '23 View Revised

Alexandria Real Estate Equities, Inc. ARE reported first-quarter 2023 adjusted funds from operations (AFFO) per share of $2.19, surpassing the Zacks Consensus Estimate of $2.15. The reported figure climbed 6.8% from the year-ago quarter’s tally. We estimated AFFO per share for the quarter to be $2.14.
Results reflect better-than-anticipated revenues on healthy leasing activity and solid rental rate growth.
Total revenues of $700.8 million in the quarter, too, outpaced the consensus estimate of $679.9 million. The figure increased 13.9% from the prior-year quarter’s $615.1 million. Our estimate for first-quarter total revenues was pegged at $679.3 million.
Behind the Headlines
Reflecting robust demand for its high-quality office/laboratory space, Alexandria’s total leasing activity aggregated 1.2 million rentable square feet (RSF) of space in the first quarter. Lease renewals and re-leasing of space amounted to 1.1 million RSF.
Alexandria registered rental rate growth of 48.3% during the reported quarter. On a cash basis, the rental rate increased 24.2%.
On a year-over-year basis, same-property net operating income (NOI) was up 3.7%. It improved 9% on a cash basis. The occupancy of operating properties in North America was 93.6%, down from 94.7% in the prior-year quarter.
In the reported quarter, investment-grade or publicly-traded large-cap tenants accounted for 49% of the annual rental revenues in effect. The weighted-average remaining lease term of all tenants is 7.2 years. For Alexandria’s top 20 tenants, it is 9.5 years.
As of Mar 31, 2023, the tenant receivable balance was $8.2 million.
Alexandria completed acquisitions totaling 1.1 million RSF of value-creation opportunities for a total price of $171.9 million. Also, the company placed into service development and redevelopment projects totaling 453,511 RSF across multiple submarkets, which resulted in $23 million of incremental annual NOI.
Liquidity
Alexandria exited first-quarter 2023 with cash and cash equivalents of $1.3 billion, up from $825.2 million as of Dec 31, 2022. It had $5.3 billion of liquidity at the end of the reported quarter.
The net debt and preferred stock to adjusted EBITDA was 5.3X, and the fixed-charge coverage was 5.0X in the first quarter on an annualized basis. As of the first-quarter end, ARE had no debt maturities before 2025, and its weighted-average remaining term was 13.4 years.
As of Mar 31, 2023, the company’s remaining aggregate amount available under its at-the-market program for future sales of common stock was $141.9 million.
Revised 2023 Guidance
Alexandria narrowed its 2022 guidance for AFFO per share.
It now projects the same to lie in the range of $8.91-$9.01, narrowed by 10 cents from $8.86-$9.06 estimated earlier. The mid-point was unchanged at $8.96. The Zacks Consensus Estimate for the FFO per share is currently pegged at $8.95, which lies within the guided range.
While ARE maintained its guidance for same-property NOI growth at 2-4%, it increased the same for rental rate increases for lease renewals and re-leasing of space from 27-32% to 28-33%. However, it lowered its guidance for occupancy in North America (as of Dec 31, 2023) in the band of 94.6-95.6% from 94.8-95.8% guided earlier.
Alexandria currently carries a Zacks Rank #3 (Hold). You can see the complete list of today’s Zacks #1 Rank (Strong Buy) stocks here.
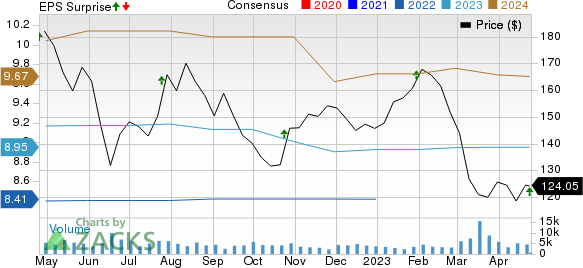
Alexandria Real Estate Equities, Inc. Price, Consensus and EPS Surprise
Alexandria Real Estate Equities, Inc. price-consensus-eps-surprise-chart | Alexandria Real Estate Equities, Inc. Quote
Upcoming Earnings Releases
We now look forward to the earnings releases of other REITs like SBA Communications SBAC, slated to report on May 1. Host Hotels & Resorts HST and Equinix EQIX are scheduled on May 3.
The Zacks Consensus Estimate for SBA Communications’ first-quarter 2023 FFO per share is pegged at $3.11, suggesting year-over-year growth of 5.1%. SBAC currently carries a Zacks Rank #3.
The Zacks Consensus Estimate for Host Hotels & Resorts’ first-quarter 2023 FFO per share is pegged at 47 cents, implying a year-over-year increase of 20.5%. HST currently carries a Zacks Rank of 3.
The Zacks Consensus Estimate for Equinix’s first-quarter 2023 FFO per share stands at $7.92, indicating a year-over-year increase of 10.6%. EQIX currently has a Zacks Rank #2 (Buy).
Note: Anything related to earnings presented in this write-up represents FFO — a widely used metric to gauge the performance of REITs.
Want the latest recommendations from Zacks Investment Research? Today, you can download 7 Best Stocks for the Next 30 Days. Click to get this free report
Host Hotels & Resorts, Inc. (HST) : Free Stock Analysis Report
Equinix, Inc. (EQIX) : Free Stock Analysis Report
SBA Communications Corporation (SBAC) : Free Stock Analysis Report
Alexandria Real Estate Equities, Inc. (ARE) : Free Stock Analysis Report
