
 Yahoo Finance
 Aflac Inc's Dividend Analysis
Exploring the Sustainability and Growth of Aflac Inc's Dividends
Introduction to Aflac Inc's Dividend Announcement
Aflac Inc (NYSE:AFL) recently announced a dividend of $0.5 per share, payable on 2024-06-03, with the ex-dividend date set for 2024-05-21. As investors look forward to this upcoming payment, the spotlight also shines on the company's dividend history, yield, and growth rates. Using the data from GuruFocus, let's look into Aflac Inc's dividend performance and assess its sustainability.
What Does Aflac Inc Do?
This Powerful Chart Made Peter Lynch 29% A Year For 13 Years
How to calculate the intrinsic value of a stock?
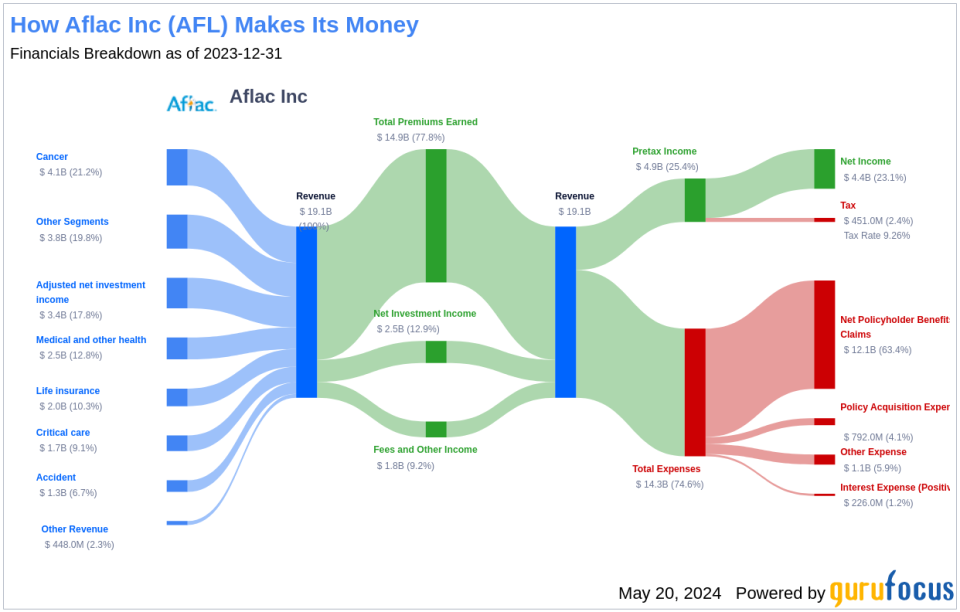
Aflac Inc offers supplemental health insurance and life insurance in the United States and Japan. In addition to its cancer policies, the company has broadened its product offerings to include accident, dental and vision, disability, and long-term-care insurance. It markets its products through independent distributors, selling the majority of its policies directly to consumers at their places of work and also reaches out to its customers out of their worksite through digital mediums. The company has two reportable business segments; Aflac Japan, which generates the majority of the revenue, and Aflac U.S.
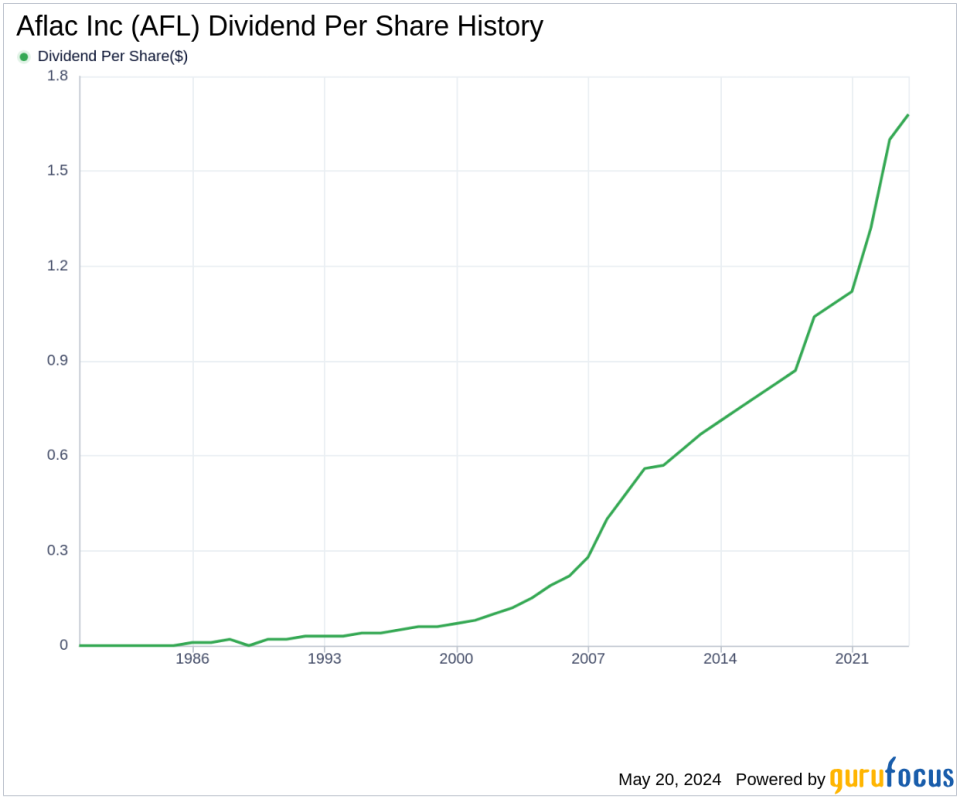
A Glimpse at Aflac Inc's Dividend History
Aflac Inc has maintained a consistent dividend payment record since 1983, distributing dividends on a quarterly basis. Aflac Inc has also increased its dividend each year since 1983, earning it the status of a dividend aristocrata title awarded to companies that have increased their dividend each year for at least the past 41 years. Below is a chart showing annual Dividends Per Share for tracking historical trends.
Breaking Down Aflac Inc's Dividend Yield and Growth
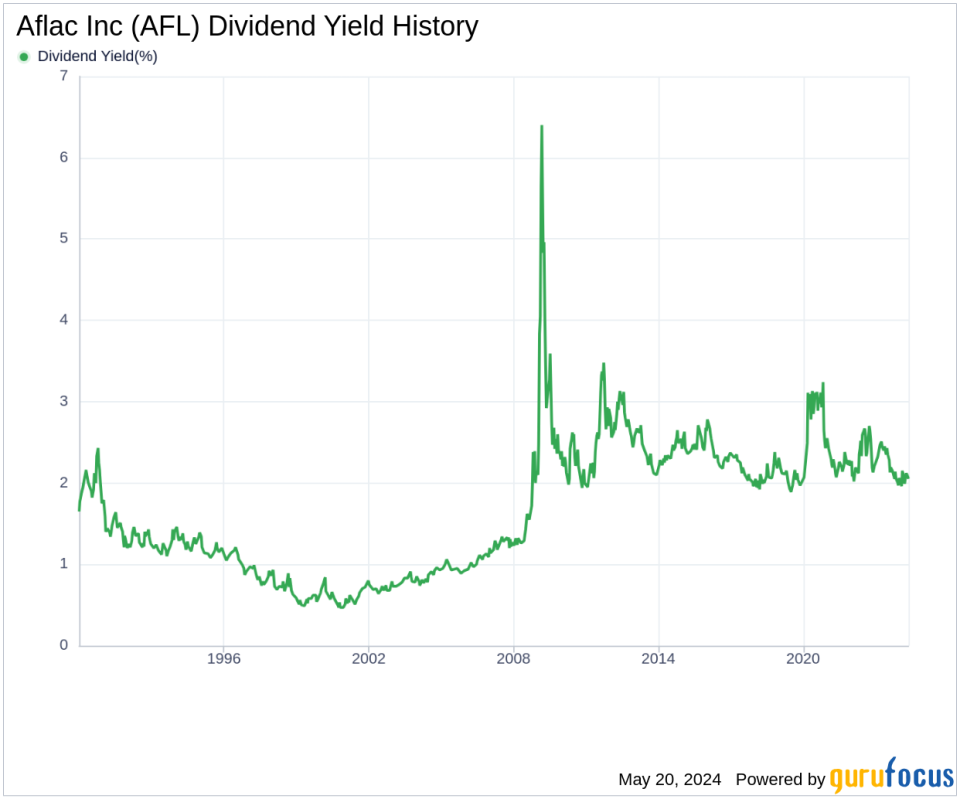
As of today, Aflac Inc currently has a 12-month trailing dividend yield of 1.99% and a 12-month forward dividend yield of 2.26%, suggesting an expectation of increased dividend payments over the next 12 months. Over the past three years, Aflac Inc's annual dividend growth rate was 14.50%, which decreased to 11.30% per year over a five-year horizon. Over the past decade, the annual dividends per share growth rate stands at 9.20%. Based on Aflac Inc's dividend yield and five-year growth rate, the 5-year yield on cost of Aflac Inc stock as of today is approximately 3.40%.
The Sustainability Question: Payout Ratio and Profitability
To assess the sustainability of the dividend, one needs to evaluate the company's payout ratio. The dividend payout ratio provides insights into the portion of earnings the company distributes as dividends. A lower ratio suggests that the company retains a significant part of its earnings, thereby ensuring the availability of funds for future growth and unexpected downturns. As of 2024-03-31, Aflac Inc's dividend payout ratio is 0.27. Aflac Inc's profitability rank, offers an understanding of the company's earnings prowess relative to its peers. GuruFocus ranks Aflac Inc's profitability 6 out of 10 as of 2024-03-31, suggesting fair profitability. The company has reported positive net income for each year over the past decade, further solidifying its high profitability.
Growth Metrics: The Future Outlook
To ensure the sustainability of dividends, a company must have robust growth metrics. Aflac Inc's growth rank of 6 out of 10 suggests that the company has a fair growth outlook. Revenue is the lifeblood of any company, and Aflac Inc's revenue per share, combined with the 3-year revenue growth rate, indicates a strong revenue model. Aflac Inc's revenue has increased by approximately 0.40% per year on average, a rate that underperforms approximately 68.21% of global competitors. The company's 3-year EPS growth rate showcases its capability to grow its earnings, a critical component for sustaining dividends in the long run. During the past three years, Aflac Inc's earnings increased by approximately 9.00% per year on average, a rate that underperforms approximately 50.99% of global competitors. Lastly, the company's 5-year EBITDA growth rate of 9.20%, which underperforms approximately 41.61% of global competitors.
Conclusion
Considering Aflac Inc's consistent dividend payments, growth in dividend rates, and solid payout ratio, the company presents itself as a potentially attractive option for investors seeking steady income through dividends. The company's ability to maintain profitability and a fair growth outlook further reinforces the sustainability of its dividends. For those looking to explore more high-dividend yield opportunities, GuruFocus Premium users can screen for high-dividend yield stocks using the High Dividend Yield Screener.
This article, generated by GuruFocus, is designed to provide general insights and is not tailored financial advice. Our commentary is rooted in historical data and analyst projections, utilizing an impartial methodology, and is not intended to serve as specific investment guidance. It does not formulate a recommendation to purchase or divest any stock and does not consider individual investment objectives or financial circumstances. Our objective is to deliver long-term, fundamental data-driven analysis. Be aware that our analysis might not incorporate the most recent, price-sensitive company announcements or qualitative information. GuruFocus holds no position in the stocks mentioned herein.
This article first appeared on GuruFocus.
