
 Yahoo Finance
 Advance ZincTek (ASX:ANO) Could Be Struggling To Allocate Capital
If you're not sure where to start when looking for the next multi-bagger, there are a few key trends you should keep an eye out for. Firstly, we'll want to see a proven return on capital employed (ROCE) that is increasing, and secondly, an expanding base of capital employed. This shows us that it's a compounding machine, able to continually reinvest its earnings back into the business and generate higher returns. Having said that, from a first glance at Advance ZincTek (ASX:ANO) we aren't jumping out of our chairs at how returns are trending, but let's have a deeper look.
Return On Capital Employed (ROCE): What Is It?
For those who don't know, ROCE is a measure of a company's yearly pre-tax profit (its return), relative to the capital employed in the business. To calculate this metric for Advance ZincTek, this is the formula:
Return on Capital Employed = Earnings Before Interest and Tax (EBIT) ÷ (Total Assets - Current Liabilities)
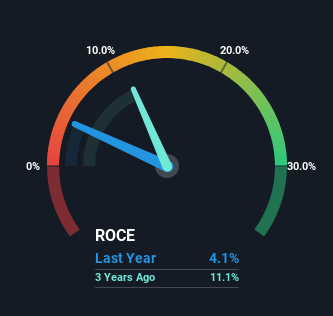
0.041 = AU$1.5m ÷ (AU$40m - AU$2.7m) (Based on the trailing twelve months to December 2023).
So, Advance ZincTek has an ROCE of 4.1%. Ultimately, that's a low return and it under-performs the Chemicals industry average of 5.5%.
View our latest analysis for Advance ZincTek
While the past is not representative of the future, it can be helpful to know how a company has performed historically, which is why we have this chart above. If you want to delve into the historical earnings , check out these free graphs detailing revenue and cash flow performance of Advance ZincTek.
The Trend Of ROCE
On the surface, the trend of ROCE at Advance ZincTek doesn't inspire confidence. Over the last five years, returns on capital have decreased to 4.1% from 19% five years ago. However it looks like Advance ZincTek might be reinvesting for long term growth because while capital employed has increased, the company's sales haven't changed much in the last 12 months. It's worth keeping an eye on the company's earnings from here on to see if these investments do end up contributing to the bottom line.
In Conclusion...
Bringing it all together, while we're somewhat encouraged by Advance ZincTek's reinvestment in its own business, we're aware that returns are shrinking. It seems that investors have little hope of these trends getting any better and that may have partly contributed to the stock collapsing 83% in the last five years. In any case, the stock doesn't have these traits of a multi-bagger discussed above, so if that's what you're looking for, we think you'd have more luck elsewhere.
If you want to know some of the risks facing Advance ZincTek we've found 3 warning signs (1 shouldn't be ignored!) that you should be aware of before investing here.
While Advance ZincTek isn't earning the highest return, check out this free list of companies that are earning high returns on equity with solid balance sheets.
Have feedback on this article? Concerned about the content? Get in touch with us directly. Alternatively, email editorial-team (at) simplywallst.com.
This article by Simply Wall St is general in nature. We provide commentary based on historical data and analyst forecasts only using an unbiased methodology and our articles are not intended to be financial advice. It does not constitute a recommendation to buy or sell any stock, and does not take account of your objectives, or your financial situation. We aim to bring you long-term focused analysis driven by fundamental data. Note that our analysis may not factor in the latest price-sensitive company announcements or qualitative material. Simply Wall St has no position in any stocks mentioned.
