
 Yahoo Finance
 ACI Worldwide (NASDAQ:ACIW) shareholders have endured a 32% loss from investing in the stock a year ago
Passive investing in an index fund is a good way to ensure your own returns roughly match the overall market. But if you buy individual stocks, you can do both better or worse than that. For example, the ACI Worldwide, Inc. (NASDAQ:ACIW) share price is down 32% in the last year. That's disappointing when you consider the market declined 19%. Looking at the longer term, the stock is down 29% over three years. Shareholders have had an even rougher run lately, with the share price down 19% in the last 90 days.
Since shareholders are down over the longer term, lets look at the underlying fundamentals over the that time and see if they've been consistent with returns.
View our latest analysis for ACI Worldwide
While the efficient markets hypothesis continues to be taught by some, it has been proven that markets are over-reactive dynamic systems, and investors are not always rational. One flawed but reasonable way to assess how sentiment around a company has changed is to compare the earnings per share (EPS) with the share price.
During the unfortunate twelve months during which the ACI Worldwide share price fell, it actually saw its earnings per share (EPS) improve by 75%. It could be that the share price was previously over-hyped.
The divergence between the EPS and the share price is quite notable, during the year. So it's well worth checking out some other metrics, too.
ACI Worldwide managed to grow revenue over the last year, which is usually a real positive. Since the fundamental metrics don't readily explain the share price drop, there might be an opportunity if the market has overreacted.
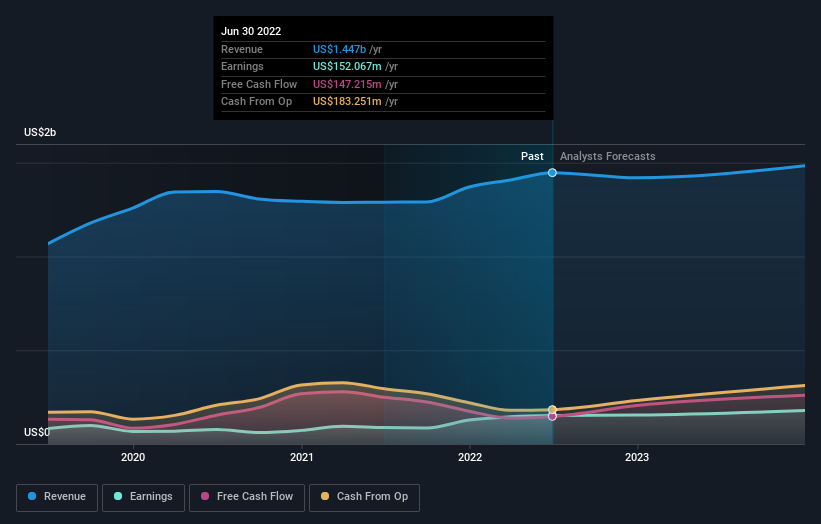
The company's revenue and earnings (over time) are depicted in the image below (click to see the exact numbers).
We like that insiders have been buying shares in the last twelve months. Even so, future earnings will be far more important to whether current shareholders make money. So it makes a lot of sense to check out what analysts think ACI Worldwide will earn in the future (free profit forecasts).
A Different Perspective
While the broader market lost about 19% in the twelve months, ACI Worldwide shareholders did even worse, losing 32%. However, it could simply be that the share price has been impacted by broader market jitters. It might be worth keeping an eye on the fundamentals, in case there's a good opportunity. Regrettably, last year's performance caps off a bad run, with the shareholders facing a total loss of 1.8% per year over five years. Generally speaking long term share price weakness can be a bad sign, though contrarian investors might want to research the stock in hope of a turnaround. It's always interesting to track share price performance over the longer term. But to understand ACI Worldwide better, we need to consider many other factors. For instance, we've identified 1 warning sign for ACI Worldwide that you should be aware of.
There are plenty of other companies that have insiders buying up shares. You probably do not want to miss this free list of growing companies that insiders are buying.
Please note, the market returns quoted in this article reflect the market weighted average returns of stocks that currently trade on US exchanges.
Have feedback on this article? Concerned about the content? Get in touch with us directly. Alternatively, email editorial-team (at) simplywallst.com.
This article by Simply Wall St is general in nature. We provide commentary based on historical data and analyst forecasts only using an unbiased methodology and our articles are not intended to be financial advice. It does not constitute a recommendation to buy or sell any stock, and does not take account of your objectives, or your financial situation. We aim to bring you long-term focused analysis driven by fundamental data. Note that our analysis may not factor in the latest price-sensitive company announcements or qualitative material. Simply Wall St has no position in any stocks mentioned.
Join A Paid User Research Session
You’ll receive a US$30 Amazon Gift card for 1 hour of your time while helping us build better investing tools for the individual investors like yourself. Sign up here
