
 Yahoo Finance
 a2 Milk (NZSE:ATM) shareholders have endured a 71% loss from investing in the stock three years ago
As an investor, mistakes are inevitable. But really big losses can really drag down an overall portfolio. So take a moment to sympathize with the long term shareholders of The a2 Milk Company Limited (NZSE:ATM), who have seen the share price tank a massive 71% over a three year period. That would be a disturbing experience. And more recent buyers are having a tough time too, with a drop of 39% in the last year. The falls have accelerated recently, with the share price down 17% in the last three months.
It's worthwhile assessing if the company's economics have been moving in lockstep with these underwhelming shareholder returns, or if there is some disparity between the two. So let's do just that.
Check out our latest analysis for a2 Milk
To quote Buffett, 'Ships will sail around the world but the Flat Earth Society will flourish. There will continue to be wide discrepancies between price and value in the marketplace...' One imperfect but simple way to consider how the market perception of a company has shifted is to compare the change in the earnings per share (EPS) with the share price movement.
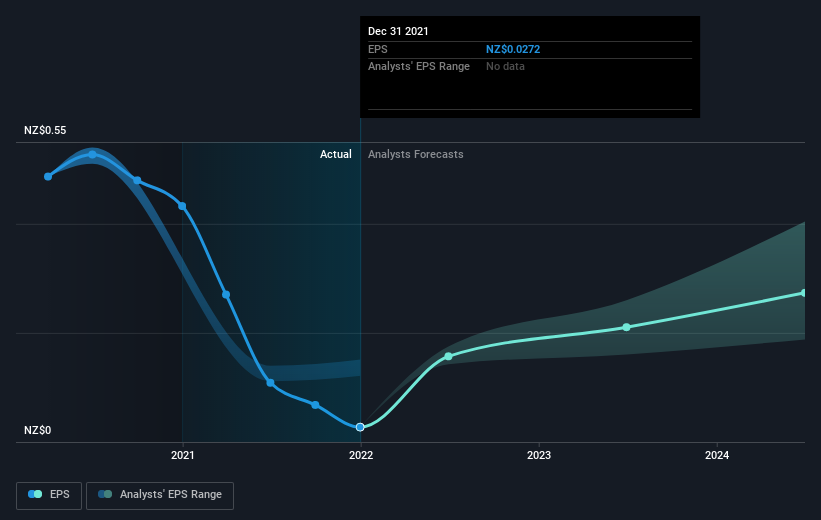
a2 Milk saw its EPS decline at a compound rate of 57% per year, over the last three years. This fall in the EPS is worse than the 34% compound annual share price fall. So the market may not be too worried about the EPS figure, at the moment -- or it may have previously priced some of the drop in. With a P/E ratio of 172.00, it's fair to say the market sees a brighter future for the business.
The company's earnings per share (over time) is depicted in the image below (click to see the exact numbers).
Before buying or selling a stock, we always recommend a close examination of historic growth trends, available here.
A Different Perspective
While the broader market lost about 9.1% in the twelve months, a2 Milk shareholders did even worse, losing 39%. However, it could simply be that the share price has been impacted by broader market jitters. It might be worth keeping an eye on the fundamentals, in case there's a good opportunity. On the bright side, long term shareholders have made money, with a gain of 4% per year over half a decade. It could be that the recent sell-off is an opportunity, so it may be worth checking the fundamental data for signs of a long term growth trend. It's always interesting to track share price performance over the longer term. But to understand a2 Milk better, we need to consider many other factors. For instance, we've identified 3 warning signs for a2 Milk that you should be aware of.
Of course a2 Milk may not be the best stock to buy. So you may wish to see this free collection of growth stocks.
Please note, the market returns quoted in this article reflect the market weighted average returns of stocks that currently trade on NZ exchanges.
Have feedback on this article? Concerned about the content? Get in touch with us directly. Alternatively, email editorial-team (at) simplywallst.com.
This article by Simply Wall St is general in nature. We provide commentary based on historical data and analyst forecasts only using an unbiased methodology and our articles are not intended to be financial advice. It does not constitute a recommendation to buy or sell any stock, and does not take account of your objectives, or your financial situation. We aim to bring you long-term focused analysis driven by fundamental data. Note that our analysis may not factor in the latest price-sensitive company announcements or qualitative material. Simply Wall St has no position in any stocks mentioned.
