
 Yahoo Finance
 With A 5.3% Return On Equity, Is Tabcorp Holdings Limited (ASX:TAH) A Quality Stock?

Many investors are still learning about the various metrics that can be useful when analysing a stock. This article is for those who would like to learn about Return On Equity (ROE). We'll use ROE to examine Tabcorp Holdings Limited (ASX:TAH), by way of a worked example.
Our data shows Tabcorp Holdings has a return on equity of 5.3% for the last year. Another way to think of that is that for every A$1 worth of equity in the company, it was able to earn A$0.05.
See our latest analysis for Tabcorp Holdings
How Do You Calculate Return On Equity?
The formula for return on equity is:
Return on Equity = Net Profit (from continuing operations) ÷ Shareholders' Equity
Or for Tabcorp Holdings:
5.3% = AU$382m ÷ AU$7.2b (Based on the trailing twelve months to December 2019.)
Most know that net profit is the total earnings after all expenses, but the concept of shareholders' equity is a little more complicated. It is the capital paid in by shareholders, plus any retained earnings. The easiest way to calculate shareholders' equity is to subtract the company's total liabilities from the total assets.
What Does ROE Mean?
ROE looks at the amount a company earns relative to the money it has kept within the business. The 'return' is the yearly profit. That means that the higher the ROE, the more profitable the company is. So, all else being equal, a high ROE is better than a low one. Clearly, then, one can use ROE to compare different companies.
Does Tabcorp Holdings Have A Good Return On Equity?
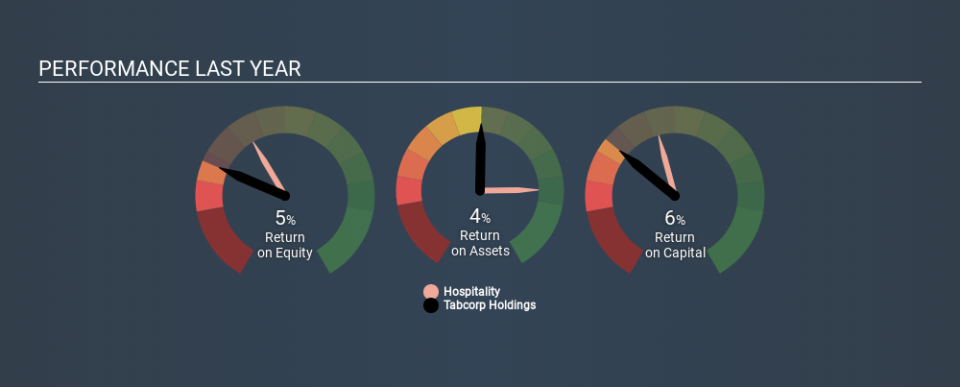
Arguably the easiest way to assess company's ROE is to compare it with the average in its industry. The limitation of this approach is that some companies are quite different from others, even within the same industry classification. As is clear from the image below, Tabcorp Holdings has a lower ROE than the average (11%) in the Hospitality industry.
That certainly isn't ideal. It is better when the ROE is above industry average, but a low one doesn't necessarily mean the business is overpriced. Still, shareholders might want to check if insiders have been selling.
How Does Debt Impact Return On Equity?
Most companies need money -- from somewhere -- to grow their profits. The cash for investment can come from prior year profits (retained earnings), issuing new shares, or borrowing. In the case of the first and second options, the ROE will reflect this use of cash, for growth. In the latter case, the debt required for growth will boost returns, but will not impact the shareholders' equity. That will make the ROE look better than if no debt was used.
Combining Tabcorp Holdings's Debt And Its 5.3% Return On Equity
While Tabcorp Holdings does have some debt, with debt to equity of just 0.53, we wouldn't say debt is excessive. Its ROE isn't particularly impressive, but the debt levels are quite modest, so the business probably has some real potential. Conservative use of debt to boost returns is usually a good move for shareholders, though it does leave the company more exposed to interest rate rises.
In Summary
Return on equity is useful for comparing the quality of different businesses. In my book the highest quality companies have high return on equity, despite low debt. All else being equal, a higher ROE is better.
But when a business is high quality, the market often bids it up to a price that reflects this. Profit growth rates, versus the expectations reflected in the price of the stock, are a particularly important to consider. So I think it may be worth checking this free report on analyst forecasts for the company.
Of course, you might find a fantastic investment by looking elsewhere. So take a peek at this free list of interesting companies.
If you spot an error that warrants correction, please contact the editor at editorial-team@simplywallst.com. This article by Simply Wall St is general in nature. It does not constitute a recommendation to buy or sell any stock, and does not take account of your objectives, or your financial situation. Simply Wall St has no position in the stocks mentioned.
We aim to bring you long-term focused research analysis driven by fundamental data. Note that our analysis may not factor in the latest price-sensitive company announcements or qualitative material. Thank you for reading.
