
 Yahoo Finance
 The 30% return this week takes Step One Clothing's (ASX:STP) shareholders one-year gains to 46%
These days it's easy to simply buy an index fund, and your returns should (roughly) match the market. But investors can boost returns by picking market-beating companies to own shares in. For example, the Step One Clothing Limited (ASX:STP) share price is up 46% in the last 1 year, clearly besting the market return of around 0.8% (not including dividends). So that should have shareholders smiling. Note that businesses generally develop over the long term, so the returns over the last year might not reflect a long term trend.
The past week has proven to be lucrative for Step One Clothing investors, so let's see if fundamentals drove the company's one-year performance.
Check out our latest analysis for Step One Clothing
While markets are a powerful pricing mechanism, share prices reflect investor sentiment, not just underlying business performance. One imperfect but simple way to consider how the market perception of a company has shifted is to compare the change in the earnings per share (EPS) with the share price movement.
During the last year Step One Clothing grew its earnings per share, moving from a loss to a profit.
When a company is just on the edge of profitability it can be well worth considering other metrics in order to more precisely gauge growth (and therefore understand share price movements).
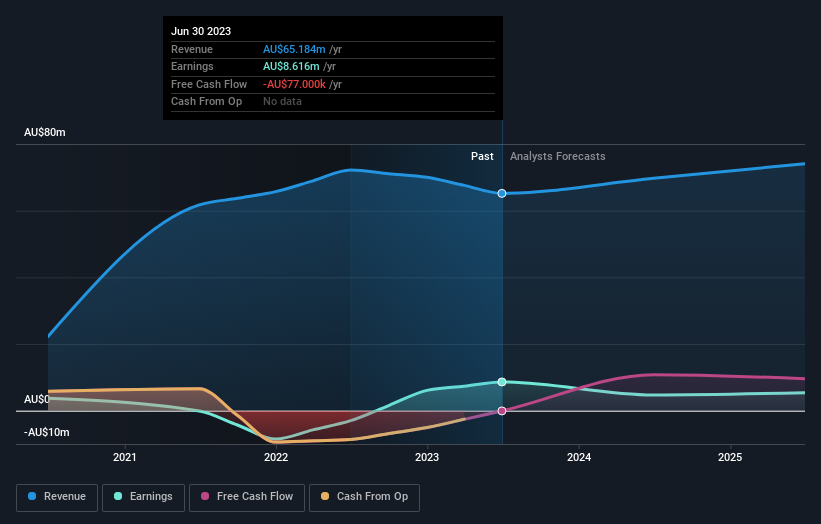
Absent any improvement, we don't think a thirst for dividends is pushing up the Step One Clothing's share price. It saw it's revenue decline by 9.7% over twelve months. It's fair to say we're a little surprised to see the share price up, and that makes us cautious.
The image below shows how earnings and revenue have tracked over time (if you click on the image you can see greater detail).
We know that Step One Clothing has improved its bottom line lately, but what does the future have in store? If you are thinking of buying or selling Step One Clothing stock, you should check out this free report showing analyst profit forecasts.
A Different Perspective
It's nice to see that Step One Clothing shareholders have gained 46% over the last year, including dividends. A substantial portion of that gain has come in the last three months, with the stock up 65% in that time. Demand for the stock from multiple parties is pushing the price higher; it could be that word is getting out about its virtues as a business. It's always interesting to track share price performance over the longer term. But to understand Step One Clothing better, we need to consider many other factors. Like risks, for instance. Every company has them, and we've spotted 4 warning signs for Step One Clothing (of which 2 are concerning!) you should know about.
Of course Step One Clothing may not be the best stock to buy. So you may wish to see this free collection of growth stocks.
Please note, the market returns quoted in this article reflect the market weighted average returns of stocks that currently trade on Australian exchanges.
Have feedback on this article? Concerned about the content? Get in touch with us directly. Alternatively, email editorial-team (at) simplywallst.com.
This article by Simply Wall St is general in nature. We provide commentary based on historical data and analyst forecasts only using an unbiased methodology and our articles are not intended to be financial advice. It does not constitute a recommendation to buy or sell any stock, and does not take account of your objectives, or your financial situation. We aim to bring you long-term focused analysis driven by fundamental data. Note that our analysis may not factor in the latest price-sensitive company announcements or qualitative material. Simply Wall St has no position in any stocks mentioned.
