
 Yahoo Finance
2018 housing declines hit these suburbs hardest

Since the market peaked in July 2017, dwelling values in Sydney have fallen by 5.4%. Melbourne’s housing market peaked a little later than Sydney’s in November 2017 and have declined by 2.9% since their peak.
In this week’s blog, we take a look at how recent periods of value decline in Sydney and Melbourne have played out both across the city as a whole and within the individual SA4 regions.
Also read: 16 tips for property success
The recent period of decline that will be focused on for Sydney are: post 2003, GFC, 2010 declines and the recent downturn. For Melbourne, the focus will be on the GFC period, the 2010 declines and the current market downturn.
SYDNEY POST – 2003
Following the rapid growth in dwelling values at the turn of the century in Sydney the market started to fall in early 2004.
Also read: Which properties suffer most in a buyers market?
From the market peak in December 2003, values declined by -8.2% in total to January 2006. Of course, across the individual SA4 regions of the city declines varied substantially as did the length of time the declines occurred over.
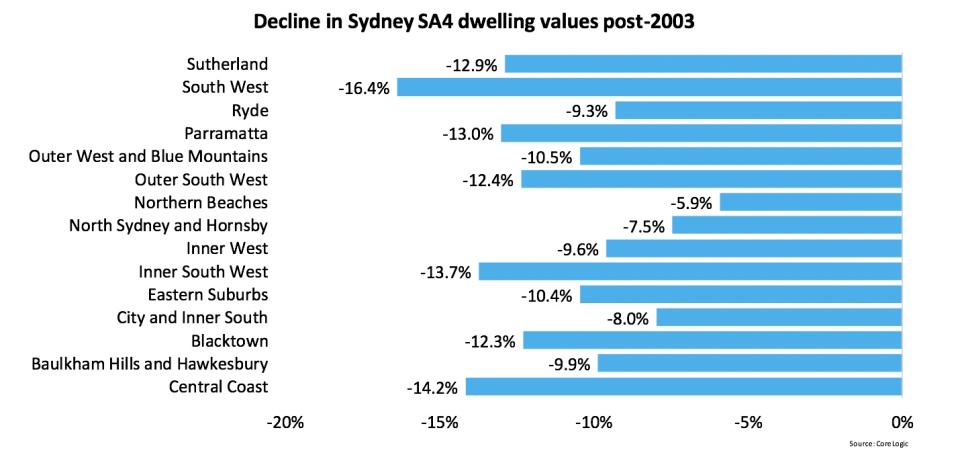
The South West (-16.4%) and Central Coast (-14.2%) recorded the largest declines in values during the post-2003 housing market downturn in Sydney. The Northern Beaches (-5.9%) and North Sydney and Hornsby (-7.5%), two of the more expensive areas of the city, recorded the most moderate declines over the period. The length of decline also varied dramatically with regions such as: Central Coast, Blacktown, Inner South West, Outer South West, Outer West and Blue Mountains, Parramatta and South West seeing elongated periods of decline. Conversely, values fell for less than a year in: Eastern Suburbs, Northern Beaches and Ryde.
Also read: Want to save more cash? Here are 3 habits to ditch right now
SYDNEY – GFC
The housing downturn in Sydney during the GFC was a very different experience to the post-2003 downturn. Whereas post-2003 it was the more affordable areas which saw the largest value falls and declines were moderate for the more expensive markets, during the GFC it was premium housing areas that recorded the greatest declines. Unlike the previous downturn, it was fairly short-lived with most regions recording value decline for only 12 months, if not less.

The areas in which values recorded the greatest falls over the downturn were the most expensive areas of the city: Eastern Suburbs (-14.0%), Northern Beaches as well as North Sydney and Hornsby (both -10.8%). Although these declines were comparatively large, each of these regions recorded falls for 15 months at the most. The most moderate declines during this downturn occurred in: South West (-2.7%) and Inner South West (-2.9%) with the regions recording values falls for nine months and seven months respectively.
Also read: Are we in an economic mess?
MELBOURNE – GFC
During the housing market downturn in the GFC, dwelling values in Melbourne fell by -9.4% in the space of 12 months. Like the Sydney experience the greatest declines tended to occur across higher valued housing markets while the falls were relatively more moderate across the more affordable regions of the city.

During the downturn, the Inner East (-15.9%) and Inner South (-15.5%) regions recorded the greatest falls. Even though these falls were substantial they occurred over just 12 months in the Inner East and 11 months in the Inner South. The North West (-2.4%) and West (-3.0%) regions of the city recorded the most moderate falls over the period with the declines taking place over five months and eight months respectively.
SYDNEY – 2010 DOWNTURN
The GFC decline in values was staved off by aggressive interest rate cuts and housing market stimulus, once interest rates began to rise and the stimulus was removed, Sydney dwelling values started to fall. Ultimately values declined by a cumulative -3.7% between September 2010 and February 2012.
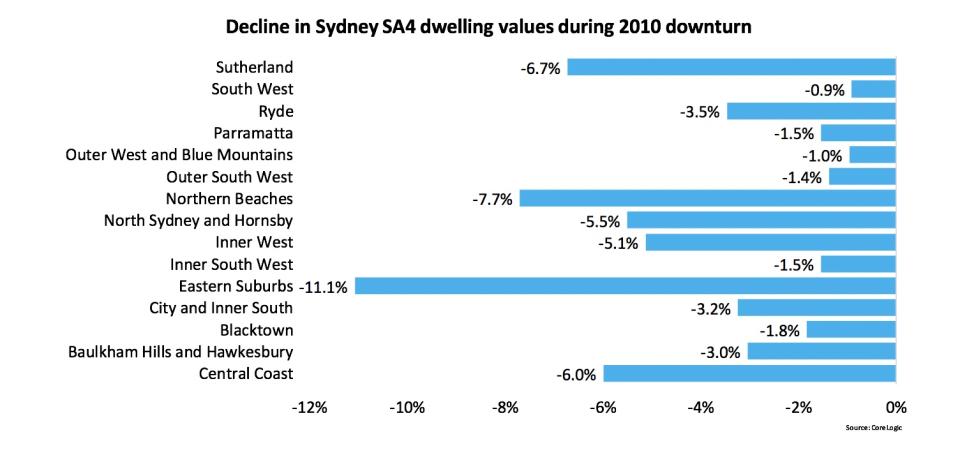
During the 2010 downturn it was once again some of the most expensive areas of the city which recorded the largest value falls: Eastern Suburbs (-11.1%) and Northern Beaches (-7.7%) while the most moderate falls occurred in more affordable housing markets: South West (-0.9%) and Outer West and Blue Mountains (-1.0%). Values in the Eastern Suburbs and Northern Beaches declined for 20 months while in South West and Outer West and Blue Mountains, values fell for only six months and 11 months respectively.
MELBOURNE – 2010 DOWNTURN
As housing market stimulus was wound out of the market in 2010, values in Melbourne fell by -8.4% between November 2010 and February 2012. Like the GFC downturn, the value falls tended to be much greater for the higher value areas of the city.
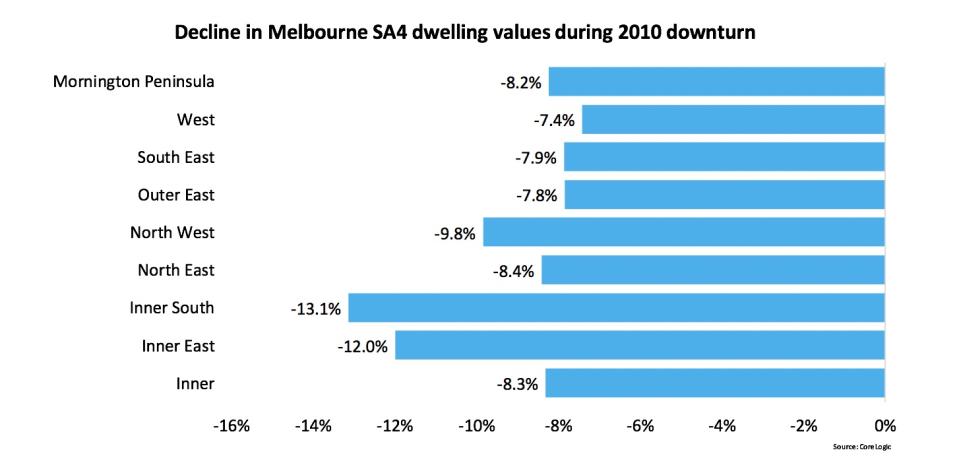
The greatest declines throughout this downturn were recorded in the Inner South (-13.1%) and the Inner East (-12.0%) with values falling in both of these regions for 28 months. Value declines were the most moderate in the West (-7.4%) and Outer East (-7.8%) regions with values declining for a total of 16 months and 19 months respectively.
SYDNEY – CURRENT DOWNTURN
Sydney dwelling values peaked in July 2017 and over the 12 months to July 2018 they have so far fallen by -5.4%. Unlike previous downturns the areas with the largest falls have been neither the most affordable nor the most expensive areas. Furthermore, values are still rising on the Central Coast.
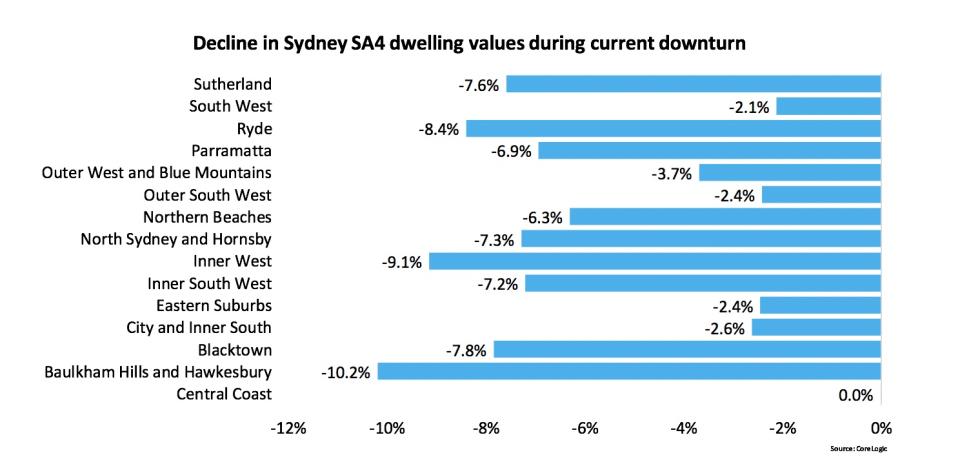
Since the market peak, Baulkham Hills and Hawkesbury (-10.2%) and Inner West (-9.1%) have recorded the greatest value declines. As mentioned, values continue to rise in Central Coast while the South West has also recorded a comparatively moderate fall of -2.1%. Outside of the post-2003 downturn, the South West has consistently recorded relatively minor falls during recent downturn periods.
MELBOURNE – CURRENT DOWNTURN
Since having peaked in November 2017, dwelling values in Melbourne have fallen by -2.9% to July 2018. Over recent months the rate of decline has been gathering pace and it is the higher value areas of the city in which the declines have been greatest so far.
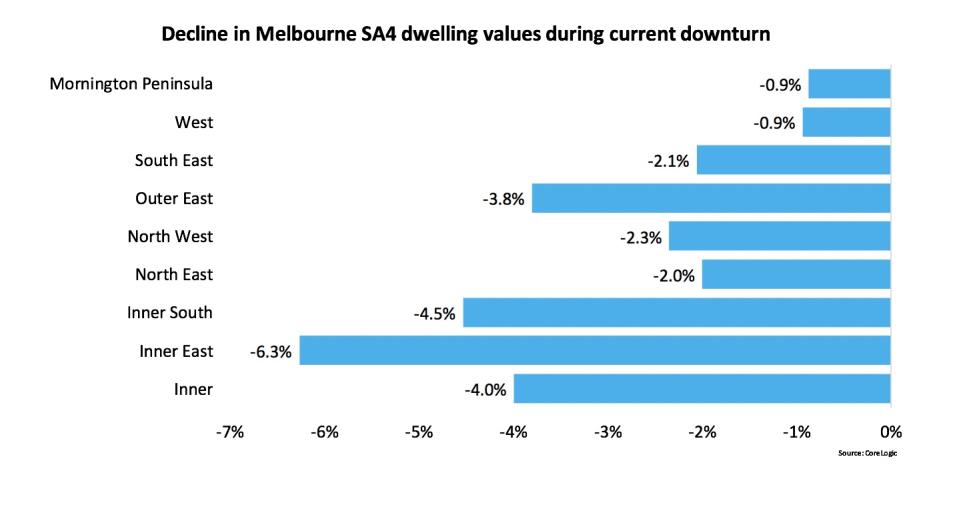
In the current downturn, the largest falls to-date have been recorded in: Inner East (-6.3%) and Inner South (-4.5%), these two regions also recorded the largest value falls over the previous two Melbourne housing market downturns. The most moderate value falls during the current downturn have occurred in Mornington Peninsula and West, both of which recorded falls of -0.9%.
While the current housing market downturn has been relatively short so far, there are some lessons that can be learned from previous downturns. The housing market downturns in 2008 and 2010-12 were largely driven by weaker economic conditions that impacted the banking and financial services sectors; consequently it was the premium end of the housing market where values weakened the most due to less demand for high priced homes and more stock in the higher price ranges entering the market.
The current downturn in Sydney and Melbourne has once again seen the banking and financial services sector impacted, with heightened credit regulation and fallout from the Royal Commission. Weaker conditions across this sector are likely contributing to weaker conditions across the premium housing sector. This trend is being compounded by the surge in first home buyer activity which is supporting housing demand across the more affordable housing price points.
Downturns in the Sydney market tend to be much more varied in terms of market segments leading the falls and that appears to be the case again now. In Melbourne, each of the downturns have seen the largest falls across the most expensive regions of the city and that appears to be the case again in the current downturn. The great unknown is how long this housing market downturn runs for but it certainly feels as if it has longer to run.
Cameron Kusher is a research analyst at CoreLogic.
