
 Yahoo Finance
 With A -17% Earnings Drop, Did Pacific Energy Limited (ASX:PEA) Really Underperform?

Want to participate in a short research study? Help shape the future of investing tools and receive a $20 prize!
In this commentary, I will examine Pacific Energy Limited’s (ASX:PEA) latest earnings update (31 December 2018) and compare these figures against its performance over the past couple of years, as well as how the rest of the renewable energy industry performed. As an investor, I find it beneficial to assess PEA’s trend over the short-to-medium term in order to gauge whether or not the company is able to meet its goals, and ultimately sustainably grow over time.
Check out our latest analysis for Pacific Energy
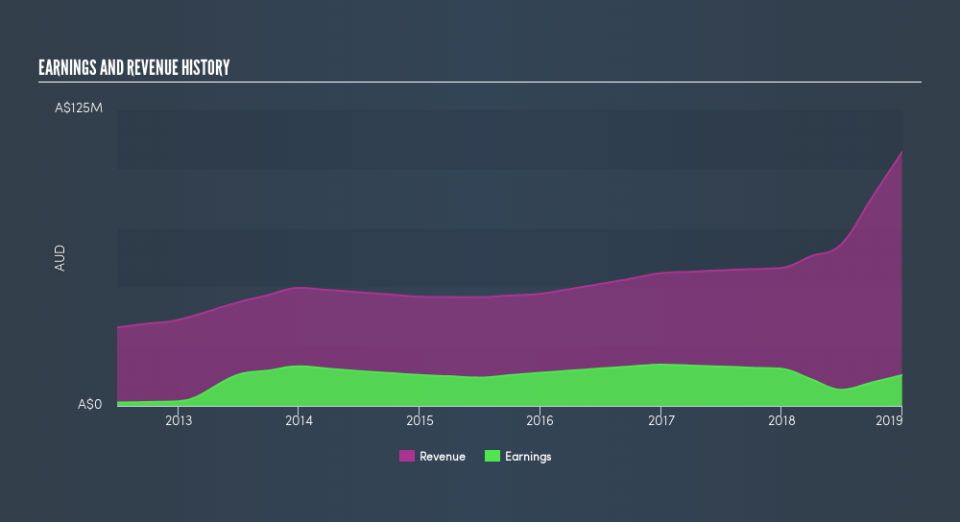
Commentary On PEA’s Past Performance
PEA’s trailing twelve-month earnings (from 31 December 2018) of AU$13m has declined by -17% compared to the previous year.
Furthermore, this one-year growth rate has been lower than its average earnings growth rate over the past 5 years of -3.6%, indicating the rate at which PEA is growing has slowed down. Why is this? Let’s examine what’s transpiring with margins and whether the entire industry is feeling the heat.
In terms of returns from investment, Pacific Energy has fallen short of achieving a 20% return on equity (ROE), recording 6.9% instead. However, its return on assets (ROA) of 5.6% exceeds the AU Renewable Energy industry of 4.2%, indicating Pacific Energy has used its assets more efficiently. And finally, its return on capital (ROC), which also accounts for Pacific Energy’s debt level, has increased over the past 3 years from 12% to 13%.
What does this mean?
Though Pacific Energy’s past data is helpful, it is only one aspect of my investment thesis. Companies that are profitable, but have unpredictable earnings, can have many factors influencing its business. You should continue to research Pacific Energy to get a more holistic view of the stock by looking at:
Future Outlook: What are well-informed industry analysts predicting for PEA’s future growth? Take a look at our free research report of analyst consensus for PEA’s outlook.
Financial Health: Are PEA’s operations financially sustainable? Balance sheets can be hard to analyze, which is why we’ve done it for you. Check out our financial health checks here.
Other High-Performing Stocks: Are there other stocks that provide better prospects with proven track records? Explore our free list of these great stocks here.
NB: Figures in this article are calculated using data from the trailing twelve months from 31 December 2018. This may not be consistent with full year annual report figures.
We aim to bring you long-term focused research analysis driven by fundamental data. Note that our analysis may not factor in the latest price-sensitive company announcements or qualitative material.
If you spot an error that warrants correction, please contact the editor at editorial-team@simplywallst.com. This article by Simply Wall St is general in nature. It does not constitute a recommendation to buy or sell any stock, and does not take account of your objectives, or your financial situation. Simply Wall St has no position in the stocks mentioned. Thank you for reading.
