
 Yahoo Finance
 Zooming in on NYSE:EIX's 3.4% Dividend Yield

Is Edison International (NYSE:EIX) a good dividend stock? How can we tell? Dividend paying companies with growing earnings can be highly rewarding in the long term. Yet sometimes, investors buy a popular dividend stock because of its yield, and then lose money if the company's dividend doesn't live up to expectations.
A high yield and a long history of paying dividends is an appealing combination for Edison International. It would not be a surprise to discover that many investors buy it for the dividends. There are a few simple ways to reduce the risks of buying Edison International for its dividend, and we'll go through these below.
Click the interactive chart for our full dividend analysis
Payout ratios
Dividends are usually paid out of company earnings. If a company is paying more than it earns, then the dividend might become unsustainable - hardly an ideal situation. As a result, we should always investigate whether a company can afford its dividend, measured as a percentage of a company's net income after tax. Although Edison International pays a dividend, it was loss-making during the past year. When a company recently reported a loss, we should investigate if its cash flows covered the dividend.
Unfortunately, while Edison International pays a dividend, it also reported negative free cash flow last year. While there may be a good reason for this, it's not ideal from a dividend perspective.
Is Edison International's Balance Sheet Risky?
Given Edison International is paying a dividend but reported a loss over the past year, we need to check its balance sheet for signs of financial distress. A rough way to check this is with these two simple ratios: a) net debt divided by EBITDA (earnings before interest, tax, depreciation and amortisation), and b) net interest cover. Net debt to EBITDA is a measure of a company's total debt. Net interest cover measures the ability to meet interest payments. Essentially we check that a) the company does not have too much debt, and b) that it can afford to pay the interest. Edison International is carrying net debt of 4.87 times its EBITDA, which is getting towards the upper limit of our comfort range on a dividend stock that the investor hopes will endure a wide range of economic circumstances.
We calculated its interest cover by measuring its earnings before interest and tax (EBIT), and dividing this by the company's net interest expense. Interest cover of 2.53 times its interest expense is starting to become a concern for Edison International, and be aware that lenders may place additional restrictions on the company as well.
We update our data on Edison International every 24 hours, so you can always get our latest analysis of its financial health, here.
Dividend Volatility
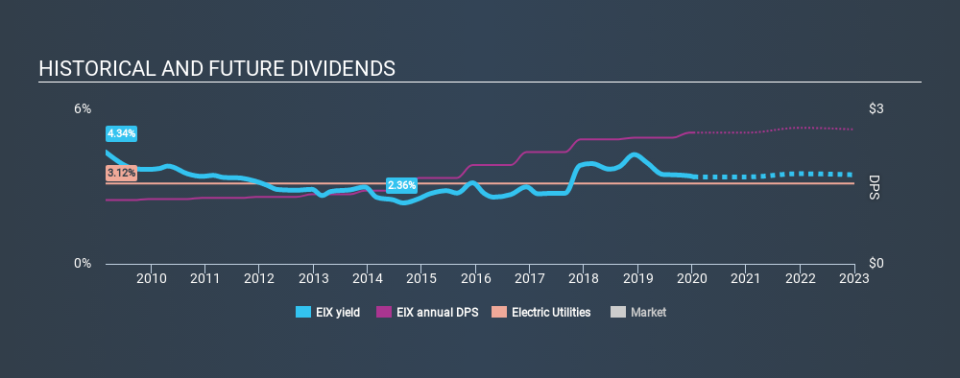
One of the major risks of relying on dividend income, is the potential for a company to struggle financially and cut its dividend. Not only is your income cut, but the value of your investment declines as well - nasty. Edison International has been paying dividends for a long time, but for the purpose of this analysis, we only examine the past 10 years of payments. During this period the dividend has been stable, which could imply the business could have relatively consistent earnings power. During the past ten-year period, the first annual payment was US$1.24 in 2010, compared to US$2.55 last year. This works out to be a compound annual growth rate (CAGR) of approximately 7.5% a year over that time.
Companies like this, growing their dividend at a decent rate, can be very valuable over the long term, if the rate of growth can be maintained.
Dividend Growth Potential
While dividend payments have been relatively reliable, it would also be nice if earnings per share (EPS) were growing, as this is essential to maintaining the dividend's purchasing power over the long term. Over the past five years, it looks as though Edison International's EPS have declined at around 40% a year. With this kind of significant decline, we always wonder what has changed in the business. Dividends are about stability, and Edison International's earnings per share, which support the dividend, have been anything but stable.
We'd also point out that Edison International issued a meaningful number of new shares in the past year. Regularly issuing new shares can be detrimental - it's hard to grow dividends per share when new shares are regularly being created.
Conclusion
Dividend investors should always want to know if a) a company's dividends are affordable, b) if there is a track record of consistent payments, and c) if the dividend is capable of growing. We're a bit uncomfortable with Edison International paying a dividend while loss-making, especially since the dividend was also not well covered by free cash flow. Moreover, earnings have been shrinking. While the dividends have been fairly steady, we'd wonder for how much longer this will be sustainable if earnings continue to decline. Using these criteria, Edison International looks quite suboptimal from a dividend investment perspective.
Without at least some growth in earnings per share over time, the dividend will eventually come under pressure either from costs or inflation. See if the 11 analysts are forecasting a turnaround in our free collection of analyst estimates here.
We have also put together a list of global stocks with a market capitalisation above $1bn and yielding more 3%.
If you spot an error that warrants correction, please contact the editor at editorial-team@simplywallst.com. This article by Simply Wall St is general in nature. It does not constitute a recommendation to buy or sell any stock, and does not take account of your objectives, or your financial situation. Simply Wall St has no position in the stocks mentioned.
We aim to bring you long-term focused research analysis driven by fundamental data. Note that our analysis may not factor in the latest price-sensitive company announcements or qualitative material. Thank you for reading.
