
 Yahoo Finance
 What Is Z Energy's (NZSE:ZEL) P/E Ratio After Its Share Price Tanked?
Unfortunately for some shareholders, the Z Energy (NZSE:ZEL) share price has dived 35% in the last thirty days. Indeed the recent decline has arguably caused some bitterness for shareholders who have held through the 52% drop over twelve months.
All else being equal, a share price drop should make a stock more attractive to potential investors. While the market sentiment towards a stock is very changeable, in the long run, the share price will tend to move in the same direction as earnings per share. So, on certain occasions, long term focussed investors try to take advantage of pessimistic expectations to buy shares at a better price. One way to gauge market expectations of a stock is to look at its Price to Earnings Ratio (PE Ratio). A high P/E implies that investors have high expectations of what a company can achieve compared to a company with a low P/E ratio.
View our latest analysis for Z Energy
How Does Z Energy's P/E Ratio Compare To Its Peers?
Z Energy's P/E of 6.40 indicates relatively low sentiment towards the stock. The image below shows that Z Energy has a lower P/E than the average (7.6) P/E for companies in the oil and gas industry.
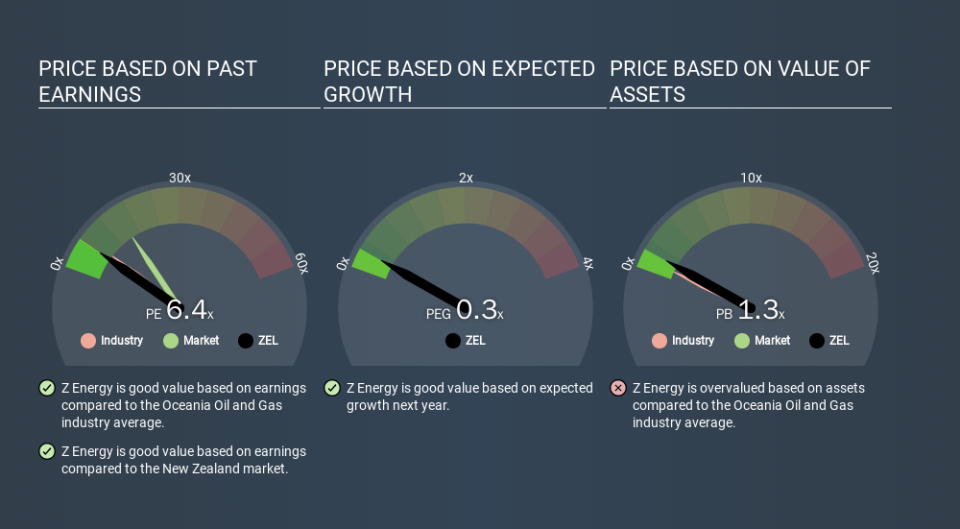
Z Energy's P/E tells us that market participants think it will not fare as well as its peers in the same industry. Many investors like to buy stocks when the market is pessimistic about their prospects. It is arguably worth checking if insiders are buying shares, because that might imply they believe the stock is undervalued.
How Growth Rates Impact P/E Ratios
Probably the most important factor in determining what P/E a company trades on is the earnings growth. Earnings growth means that in the future the 'E' will be higher. Therefore, even if you pay a high multiple of earnings now, that multiple will become lower in the future. A lower P/E should indicate the stock is cheap relative to others -- and that may attract buyers.
Z Energy shrunk earnings per share by 29% over the last year. But over the longer term (5 years) earnings per share have increased by 12%.
Don't Forget: The P/E Does Not Account For Debt or Bank Deposits
It's important to note that the P/E ratio considers the market capitalization, not the enterprise value. Thus, the metric does not reflect cash or debt held by the company. The exact same company would hypothetically deserve a higher P/E ratio if it had a strong balance sheet, than if it had a weak one with lots of debt, because a cashed up company can spend on growth.
Spending on growth might be good or bad a few years later, but the point is that the P/E ratio does not account for the option (or lack thereof).
Z Energy's Balance Sheet
Net debt totals 90% of Z Energy's market cap. If you want to compare its P/E ratio to other companies, you should absolutely keep in mind it has significant borrowings.
The Verdict On Z Energy's P/E Ratio
Z Energy has a P/E of 6.4. That's below the average in the NZ market, which is 15.6. Given meaningful debt, and a lack of recent growth, the market looks to be extrapolating this recent performance; reflecting low expectations for the future. What can be absolutely certain is that the market has become more pessimistic about Z Energy over the last month, with the P/E ratio falling from 9.9 back then to 6.4 today. For those who prefer to invest with the flow of momentum, that might be a bad sign, but for deep value investors this stock might justify some research.
Investors should be looking to buy stocks that the market is wrong about. If the reality for a company is not as bad as the P/E ratio indicates, then the share price should increase as the market realizes this. So this free visualization of the analyst consensus on future earnings could help you make the right decision about whether to buy, sell, or hold.
Of course, you might find a fantastic investment by looking at a few good candidates. So take a peek at this free list of companies with modest (or no) debt, trading on a P/E below 20.
If you spot an error that warrants correction, please contact the editor at editorial-team@simplywallst.com. This article by Simply Wall St is general in nature. It does not constitute a recommendation to buy or sell any stock, and does not take account of your objectives, or your financial situation. Simply Wall St has no position in the stocks mentioned.
We aim to bring you long-term focused research analysis driven by fundamental data. Note that our analysis may not factor in the latest price-sensitive company announcements or qualitative material. Thank you for reading.
