
 Yahoo Finance
 Yellow (NASDAQ:YELL) shareholder returns have been decent, earning 58% in 1 year
The simplest way to invest in stocks is to buy exchange traded funds. But investors can boost returns by picking market-beating companies to own shares in. To wit, the Yellow Corporation (NASDAQ:YELL) share price is 58% higher than it was a year ago, much better than the market return of around 37% (not including dividends) in the same period. That's a solid performance by our standards! In contrast, the longer term returns are negative, since the share price is 29% lower than it was three years ago.
On the back of a solid 7-day performance, let's check what role the company's fundamentals have played in driving long term shareholder returns.
View our latest analysis for Yellow
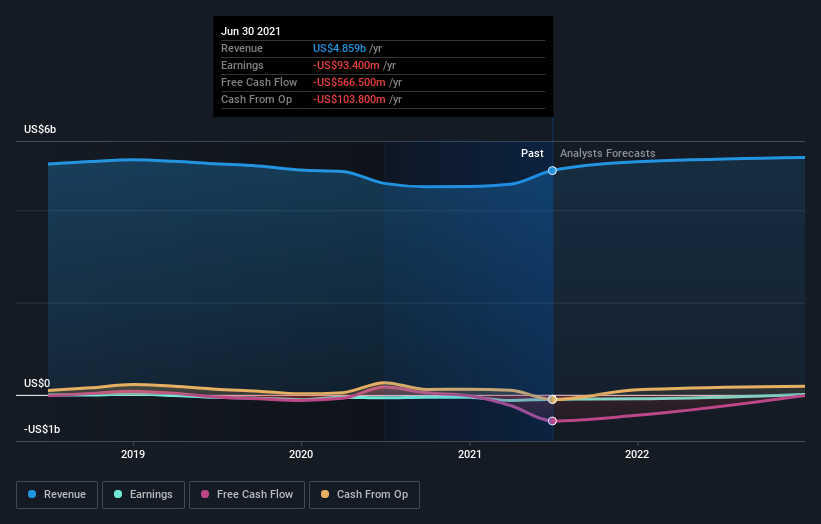
Yellow wasn't profitable in the last twelve months, it is unlikely we'll see a strong correlation between its share price and its earnings per share (EPS). Arguably revenue is our next best option. Shareholders of unprofitable companies usually expect strong revenue growth. That's because fast revenue growth can be easily extrapolated to forecast profits, often of considerable size.
Yellow grew its revenue by 6.1% last year. That's not great considering the company is losing money. The modest growth is probably largely reflected in the share price, which is up 58%. That's not a standout result, but it is solid - much like the level of revenue growth. Given the market doesn't seem too excited about the stock, a closer look at the financial data could pay off, if you can find indications of a stronger growth trend in the future.
You can see below how earnings and revenue have changed over time (discover the exact values by clicking on the image).
Take a more thorough look at Yellow's financial health with this free report on its balance sheet.
A Different Perspective
It's nice to see that Yellow shareholders have received a total shareholder return of 58% over the last year. That certainly beats the loss of about 7% per year over the last half decade. The long term loss makes us cautious, but the short term TSR gain certainly hints at a brighter future. I find it very interesting to look at share price over the long term as a proxy for business performance. But to truly gain insight, we need to consider other information, too. Consider for instance, the ever-present spectre of investment risk. We've identified 3 warning signs with Yellow (at least 1 which is concerning) , and understanding them should be part of your investment process.
If you would prefer to check out another company -- one with potentially superior financials -- then do not miss this free list of companies that have proven they can grow earnings.
Please note, the market returns quoted in this article reflect the market weighted average returns of stocks that currently trade on US exchanges.
This article by Simply Wall St is general in nature. We provide commentary based on historical data and analyst forecasts only using an unbiased methodology and our articles are not intended to be financial advice. It does not constitute a recommendation to buy or sell any stock, and does not take account of your objectives, or your financial situation. We aim to bring you long-term focused analysis driven by fundamental data. Note that our analysis may not factor in the latest price-sensitive company announcements or qualitative material. Simply Wall St has no position in any stocks mentioned.
Have feedback on this article? Concerned about the content? Get in touch with us directly. Alternatively, email editorial-team (at) simplywallst.com.
