
 Yahoo Finance
 Xunlei (NASDAQ:XNET) Is Looking To Continue Growing Its Returns On Capital
Did you know there are some financial metrics that can provide clues of a potential multi-bagger? Amongst other things, we'll want to see two things; firstly, a growing return on capital employed (ROCE) and secondly, an expansion in the company's amount of capital employed. Ultimately, this demonstrates that it's a business that is reinvesting profits at increasing rates of return. So when we looked at Xunlei (NASDAQ:XNET) and its trend of ROCE, we really liked what we saw.
Understanding Return On Capital Employed (ROCE)
For those who don't know, ROCE is a measure of a company's yearly pre-tax profit (its return), relative to the capital employed in the business. To calculate this metric for Xunlei, this is the formula:
Return on Capital Employed = Earnings Before Interest and Tax (EBIT) ÷ (Total Assets - Current Liabilities)
0.0078 = US$2.6m ÷ (US$473m - US$136m) (Based on the trailing twelve months to March 2024).
Thus, Xunlei has an ROCE of 0.8%. In absolute terms, that's a low return and it also under-performs the Software industry average of 7.2%.
View our latest analysis for Xunlei
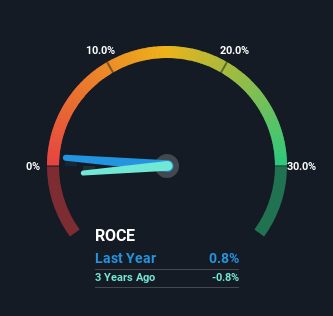
Historical performance is a great place to start when researching a stock so above you can see the gauge for Xunlei's ROCE against it's prior returns. If you'd like to look at how Xunlei has performed in the past in other metrics, you can view this free graph of Xunlei's past earnings, revenue and cash flow.
How Are Returns Trending?
Xunlei has broken into the black (profitability) and we're sure it's a sight for sore eyes. While the business was unprofitable in the past, it's now turned things around and is earning 0.8% on its capital. Interestingly, the capital employed by the business has remained relatively flat, so these higher returns are either from prior investments paying off or increased efficiencies. That being said, while an increase in efficiency is no doubt appealing, it'd be helpful to know if the company does have any investment plans going forward. Because in the end, a business can only get so efficient.
What We Can Learn From Xunlei's ROCE
To bring it all together, Xunlei has done well to increase the returns it's generating from its capital employed. And since the stock has fallen 35% over the last five years, there might be an opportunity here. With that in mind, we believe the promising trends warrant this stock for further investigation.
While Xunlei looks impressive, no company is worth an infinite price. The intrinsic value infographic for XNET helps visualize whether it is currently trading for a fair price.
For those who like to invest in solid companies, check out this free list of companies with solid balance sheets and high returns on equity.
Have feedback on this article? Concerned about the content? Get in touch with us directly. Alternatively, email editorial-team (at) simplywallst.com.
This article by Simply Wall St is general in nature. We provide commentary based on historical data and analyst forecasts only using an unbiased methodology and our articles are not intended to be financial advice. It does not constitute a recommendation to buy or sell any stock, and does not take account of your objectives, or your financial situation. We aim to bring you long-term focused analysis driven by fundamental data. Note that our analysis may not factor in the latest price-sensitive company announcements or qualitative material. Simply Wall St has no position in any stocks mentioned.
Have feedback on this article? Concerned about the content? Get in touch with us directly. Alternatively, email editorial-team@simplywallst.com
