
 Yahoo Finance
 Xponential Fitness, Inc. (NYSE:XPOF): When Will It Breakeven?
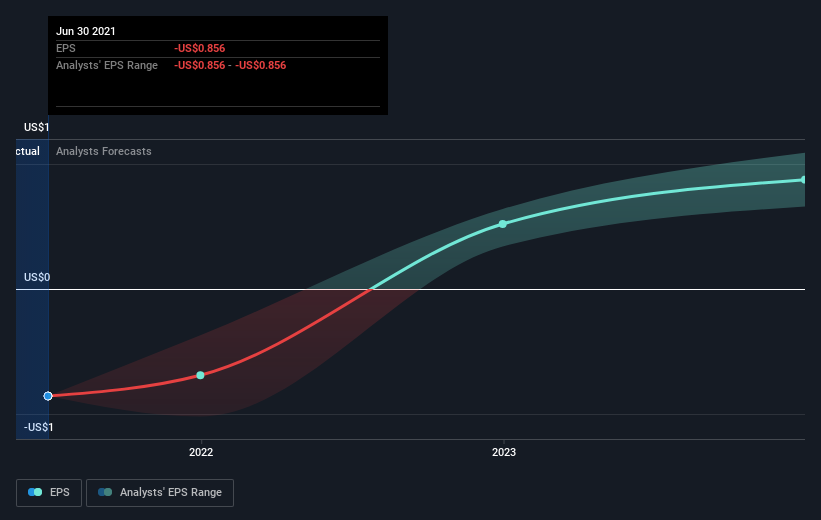
With the business potentially at an important milestone, we thought we'd take a closer look at Xponential Fitness, Inc.'s (NYSE:XPOF) future prospects. Xponential Fitness, Inc., through its subsidiaries, operates as a boutique fitness franchisor in the United States and internationally. The US$738m market-cap company posted a loss in its most recent financial year of US$14m and a latest trailing-twelve-month loss of US$20m leading to an even wider gap between loss and breakeven. As path to profitability is the topic on Xponential Fitness' investors mind, we've decided to gauge market sentiment. Below we will provide a high-level summary of the industry analysts’ expectations for the company.
Check out our latest analysis for Xponential Fitness
According to the 7 industry analysts covering Xponential Fitness, the consensus is that breakeven is near. They anticipate the company to incur a final loss in 2021, before generating positive profits of US$32m in 2022. Therefore, the company is expected to breakeven just over a year from now. What rate will the company have to grow year-on-year in order to breakeven on this date? Using a line of best fit, we calculated an average annual growth rate of 57%, which is rather optimistic! If this rate turns out to be too aggressive, the company may become profitable much later than analysts predict.
Underlying developments driving Xponential Fitness' growth isn’t the focus of this broad overview, though, take into account that by and large a high forecast growth rate is not unusual for a company that is currently undergoing an investment period.
Before we wrap up, there’s one issue worth mentioning. Xponential Fitness currently has a debt-to-equity ratio of over 2x. Typically, debt shouldn’t exceed 40% of your equity, which in this case, the company has significantly overshot. A higher level of debt requires more stringent capital management which increases the risk in investing in the loss-making company.
Next Steps:
This article is not intended to be a comprehensive analysis on Xponential Fitness, so if you are interested in understanding the company at a deeper level, take a look at Xponential Fitness' company page on Simply Wall St. We've also compiled a list of important aspects you should further research:
Valuation: What is Xponential Fitness worth today? Has the future growth potential already been factored into the price? The intrinsic value infographic in our free research report helps visualize whether Xponential Fitness is currently mispriced by the market.
Management Team: An experienced management team on the helm increases our confidence in the business – take a look at who sits on Xponential Fitness’s board and the CEO’s background.
Other High-Performing Stocks: Are there other stocks that provide better prospects with proven track records? Explore our free list of these great stocks here.
This article by Simply Wall St is general in nature. We provide commentary based on historical data and analyst forecasts only using an unbiased methodology and our articles are not intended to be financial advice. It does not constitute a recommendation to buy or sell any stock, and does not take account of your objectives, or your financial situation. We aim to bring you long-term focused analysis driven by fundamental data. Note that our analysis may not factor in the latest price-sensitive company announcements or qualitative material. Simply Wall St has no position in any stocks mentioned.
Have feedback on this article? Concerned about the content? Get in touch with us directly. Alternatively, email editorial-team (at) simplywallst.com.
