
 Yahoo Finance
 Should You Worry About Jupiter Mines Limited’s (ASX:JMS) ROCE?

Today we are going to look at Jupiter Mines Limited (ASX:JMS) to see whether it might be an attractive investment prospect. Specifically, we’re going to calculate its Return On Capital Employed (ROCE), in the hopes of getting some insight into the business.
First, we’ll go over how we calculate ROCE. Then we’ll compare its ROCE to similar companies. Then we’ll determine how its current liabilities are affecting its ROCE.
What is Return On Capital Employed (ROCE)?
ROCE is a measure of a company’s yearly pre-tax profit (its return), relative to the capital employed in the business. In general, businesses with a higher ROCE are usually better quality. Overall, it is a valuable metric that has its flaws. Author Edwin Whiting says to be careful when comparing the ROCE of different businesses, since ‘No two businesses are exactly alike.’
How Do You Calculate Return On Capital Employed?
The formula for calculating the return on capital employed is:
Return on Capital Employed = Earnings Before Interest and Tax (EBIT) ÷ (Total Assets – Current Liabilities)
Or for Jupiter Mines:
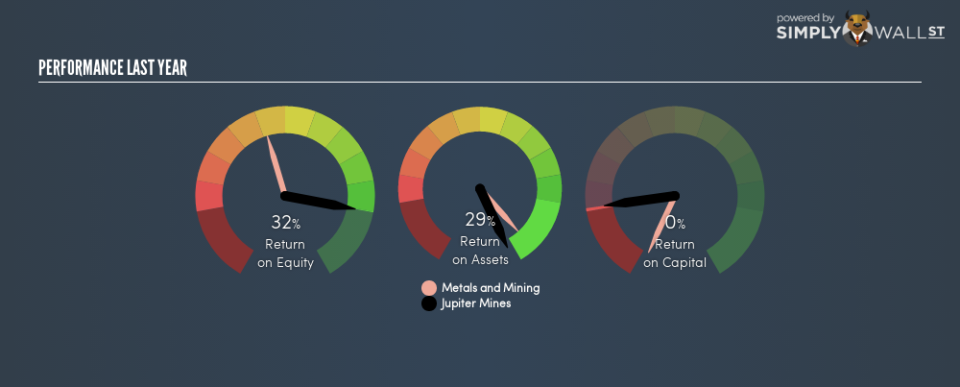
0.0026 = AU$2.3m ÷ (AU$567m – AU$41m) (Based on the trailing twelve months to August 2018.)
Therefore, Jupiter Mines has an ROCE of 0.3%.
See our latest analysis for Jupiter Mines
Does Jupiter Mines Have A Good ROCE?
One way to assess ROCE is to compare similar companies. Using our data, Jupiter Mines’s ROCE appears to be significantly below the 12% average in the Metals and Mining industry. This could be seen as a negative, as it suggests some competitors may be employing their capital more efficiently. Putting aside Jupiter Mines’s performance relative to its industry, its ROCE in absolute terms is poor – considering the risk of owning stocks compared to government bonds. Readers may wish to look for more rewarding investments.
Jupiter Mines delivered an ROCE of 0.3%, which is better than 3 years ago, as was making losses back then. That implies the business has been improving.
Remember that this metric is backwards looking – it shows what has happened in the past, and does not accurately predict the future. Companies in cyclical industries can be difficult to understand using ROCE, as returns typically look high during boom times, and low during busts. ROCE is only a point-in-time measure. We note Jupiter Mines could be considered a cyclical business. You can check if Jupiter Mines has cyclical profits by looking at this free graph of past earnings, revenue and cash flow.
What Are Current Liabilities, And How Do They Affect Jupiter Mines’s ROCE?
Current liabilities are short term bills and invoices that need to be paid in 12 months or less. Due to the way ROCE is calculated, a high level of current liabilities makes a company look as though it has less capital employed, and thus can (sometimes unfairly) boost the ROCE. To check the impact of this, we calculate if a company has high current liabilities relative to its total assets.
Jupiter Mines has total liabilities of AU$41m and total assets of AU$567m. Therefore its current liabilities are equivalent to approximately 7.3% of its total assets. Jupiter Mines has very few current liabilities, which have a minimal effect on its already low ROCE.
The Bottom Line On Jupiter Mines’s ROCE
Nevertheless, there are potentially more attractive companies to invest in. Of course you might be able to find a better stock than Jupiter Mines. So you may wish to see this free collection of other companies that have grown earnings strongly.
For those who like to find winning investments this free list of growing companies with recent insider purchasing, could be just the ticket.
To help readers see past the short term volatility of the financial market, we aim to bring you a long-term focused research analysis purely driven by fundamental data. Note that our analysis does not factor in the latest price-sensitive company announcements.
The author is an independent contributor and at the time of publication had no position in the stocks mentioned. For errors that warrant correction please contact the editor at editorial-team@simplywallst.com.
