
 Yahoo Finance
 Should We Worry About Farmers & Merchants Bancorp, Inc.'s (NASDAQ:FMAO) P/E Ratio?

This article is written for those who want to get better at using price to earnings ratios (P/E ratios). We'll look at Farmers & Merchants Bancorp, Inc.'s (NASDAQ:FMAO) P/E ratio and reflect on what it tells us about the company's share price. Based on the last twelve months, Farmers & Merchants Bancorp's P/E ratio is 16.10. In other words, at today's prices, investors are paying $16.10 for every $1 in prior year profit.
See our latest analysis for Farmers & Merchants Bancorp
How Do You Calculate A P/E Ratio?
The formula for P/E is:
Price to Earnings Ratio = Share Price ÷ Earnings per Share (EPS)
Or for Farmers & Merchants Bancorp:
P/E of 16.10 = $25.50 ÷ $1.58 (Based on the year to September 2019.)
Is A High Price-to-Earnings Ratio Good?
The higher the P/E ratio, the higher the price tag of a business, relative to its trailing earnings. That isn't necessarily good or bad, but a high P/E implies relatively high expectations of what a company can achieve in the future.
Does Farmers & Merchants Bancorp Have A Relatively High Or Low P/E For Its Industry?
We can get an indication of market expectations by looking at the P/E ratio. The image below shows that Farmers & Merchants Bancorp has a higher P/E than the average (12.7) P/E for companies in the banks industry.
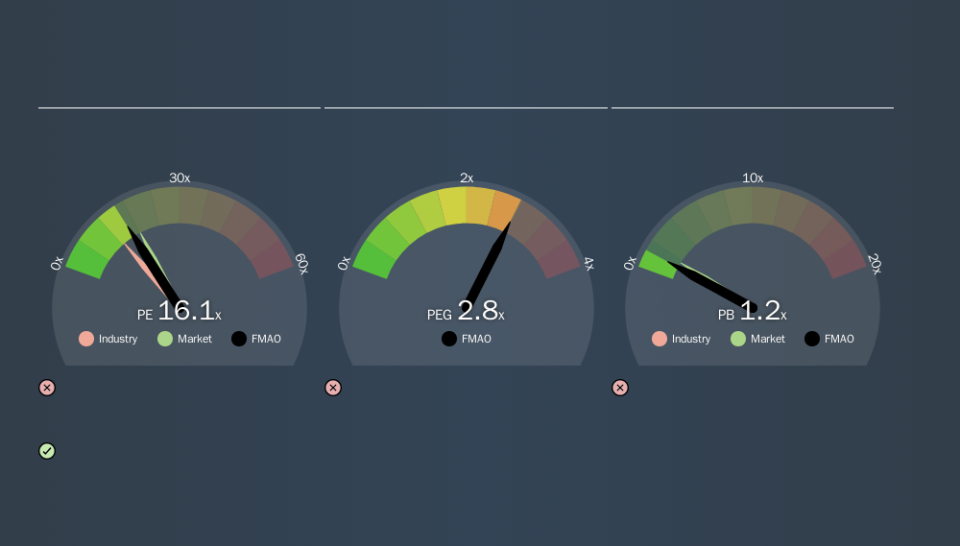
Farmers & Merchants Bancorp's P/E tells us that market participants think the company will perform better than its industry peers, going forward. Clearly the market expects growth, but it isn't guaranteed. So further research is always essential. I often monitor director buying and selling.
How Growth Rates Impact P/E Ratios
P/E ratios primarily reflect market expectations around earnings growth rates. Earnings growth means that in the future the 'E' will be higher. That means unless the share price increases, the P/E will reduce in a few years. So while a stock may look expensive based on past earnings, it could be cheap based on future earnings.
Farmers & Merchants Bancorp saw earnings per share decrease by 3.3% last year. But over the longer term (5 years) earnings per share have increased by 9.5%.
Don't Forget: The P/E Does Not Account For Debt or Bank Deposits
It's important to note that the P/E ratio considers the market capitalization, not the enterprise value. So it won't reflect the advantage of cash, or disadvantage of debt. The exact same company would hypothetically deserve a higher P/E ratio if it had a strong balance sheet, than if it had a weak one with lots of debt, because a cashed up company can spend on growth.
Such expenditure might be good or bad, in the long term, but the point here is that the balance sheet is not reflected by this ratio.
Is Debt Impacting Farmers & Merchants Bancorp's P/E?
With net cash of US$64m, Farmers & Merchants Bancorp has a very strong balance sheet, which may be important for its business. Having said that, at 23% of its market capitalization the cash hoard would contribute towards a higher P/E ratio.
The Bottom Line On Farmers & Merchants Bancorp's P/E Ratio
Farmers & Merchants Bancorp trades on a P/E ratio of 16.1, which is below the US market average of 18.2. The recent drop in earnings per share would make investors cautious, the healthy balance sheet means the company retains potential for future growth. If that occurs, the current low P/E could prove to be temporary.
Investors have an opportunity when market expectations about a stock are wrong. If it is underestimating a company, investors can make money by buying and holding the shares until the market corrects itself. So this free visualization of the analyst consensus on future earnings could help you make the right decision about whether to buy, sell, or hold.
Of course, you might find a fantastic investment by looking at a few good candidates. So take a peek at this free list of companies with modest (or no) debt, trading on a P/E below 20.
We aim to bring you long-term focused research analysis driven by fundamental data. Note that our analysis may not factor in the latest price-sensitive company announcements or qualitative material.
If you spot an error that warrants correction, please contact the editor at editorial-team@simplywallst.com. This article by Simply Wall St is general in nature. It does not constitute a recommendation to buy or sell any stock, and does not take account of your objectives, or your financial situation. Simply Wall St has no position in the stocks mentioned. Thank you for reading.
