
 Yahoo Finance
 Should You Worry About Cellmid Limited's (ASX:CDY) CEO Pay Cheque?

In 2007 Maria Halasz was appointed CEO of Cellmid Limited (ASX:CDY). This report will, first, examine the CEO compensation levels in comparison to CEO compensation at companies of similar size. Then we'll look at a snap shot of the business growth. And finally - as a second measure of performance - we will look at the returns shareholders have received over the last few years. This process should give us an idea about how appropriately the CEO is paid.
View our latest analysis for Cellmid
How Does Maria Halasz's Compensation Compare With Similar Sized Companies?
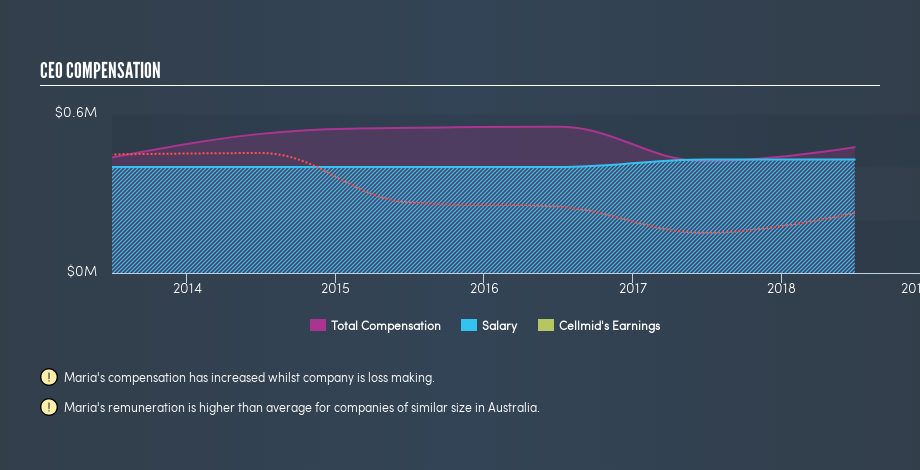
At the time of writing our data says that Cellmid Limited has a market cap of AU$18m, and is paying total annual CEO compensation of AU$474k. (This figure is for the year to June 2018). While we always look at total compensation first, we note that the salary component is less, at AU$429k. We took a group of companies with market capitalizations below AU$295m, and calculated the median CEO total compensation to be AU$355k.
As you can see, Maria Halasz is paid more than the median CEO pay at companies of a similar size, in the same market. However, this does not necessarily mean Cellmid Limited is paying too much. A closer look at the performance of the underlying business will give us a better idea about whether the pay is particularly generous.
You can see a visual representation of the CEO compensation at Cellmid, below.
Is Cellmid Limited Growing?
On average over the last three years, Cellmid Limited has grown earnings per share (EPS) by 1.4% each year (using a line of best fit). Its revenue is up 7.1% over last year.
I'm not particularly impressed by the revenue growth, but it is good to see modest EPS growth. It's clear the performance has been quite decent, but it it falls short of outstanding,based on this information. Although we don't have analyst forecasts, shareholders might want to examine this detailed historical graph of earnings, revenue and cash flow.
Has Cellmid Limited Been A Good Investment?
Given the total loss of 67% over three years, many shareholders in Cellmid Limited are probably rather dissatisfied, to say the least. This suggests it would be unwise for the company to pay the CEO too generously.
In Summary...
We compared the total CEO remuneration paid by Cellmid Limited, and compared it to remuneration at a group of similar sized companies. As discussed above, we discovered that the company pays more than the median of that group.
Over the last three years, shareholder returns have been downright disappointing, and the underlying business has failed to impress us. Considering this, we have the opinion that the CEO pay is more on the generous side, than the modest side. If you think CEO compensation levels are interesting you will probably really like this free visualization of insider trading at Cellmid.
Important note: Cellmid may not be the best stock to buy. You might find something better in this list of interesting companies with high ROE and low debt.
We aim to bring you long-term focused research analysis driven by fundamental data. Note that our analysis may not factor in the latest price-sensitive company announcements or qualitative material.
If you spot an error that warrants correction, please contact the editor at editorial-team@simplywallst.com. This article by Simply Wall St is general in nature. It does not constitute a recommendation to buy or sell any stock, and does not take account of your objectives, or your financial situation. Simply Wall St has no position in the stocks mentioned. Thank you for reading.
