
 Yahoo Finance
 Should We Worry About Advance NanoTek Limited’s (ASX:ANO) P/E Ratio?

Want to participate in a short research study? Help shape the future of investing tools and you could win a $250 gift card!
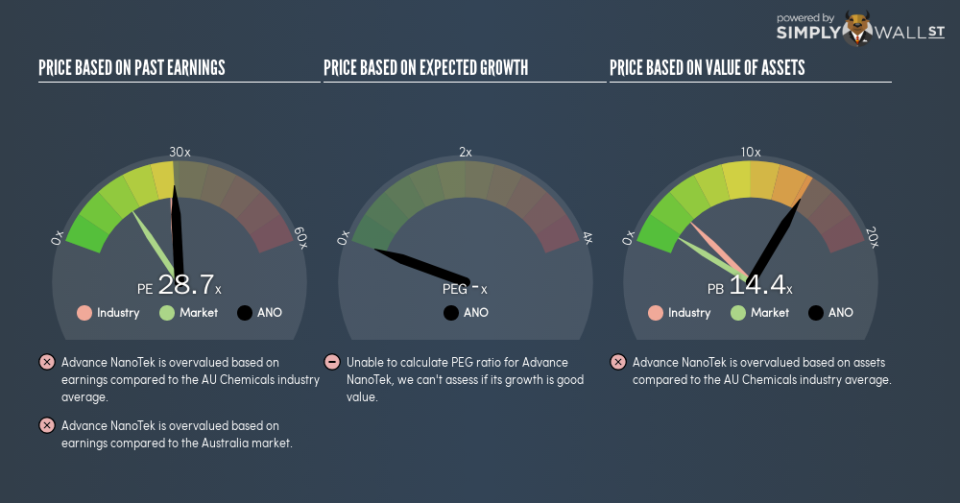
This article is for investors who would like to improve their understanding of price to earnings ratios (P/E ratios). We’ll show how you can use Advance NanoTek Limited’s (ASX:ANO) P/E ratio to inform your assessment of the investment opportunity. Advance NanoTek has a price to earnings ratio of 28.71, based on the last twelve months. That is equivalent to an earnings yield of about 3.5%.
See our latest analysis for Advance NanoTek
How Do I Calculate A Price To Earnings Ratio?
The formula for price to earnings is:
Price to Earnings Ratio = Price per Share ÷ Earnings per Share (EPS)
Or for Advance NanoTek:
P/E of 28.71 = A$2.1 ÷ A$0.073 (Based on the year to December 2018.)
Is A High P/E Ratio Good?
A higher P/E ratio means that buyers have to pay a higher price for each A$1 the company has earned over the last year. That is not a good or a bad thing per se, but a high P/E does imply buyers are optimistic about the future.
How Growth Rates Impact P/E Ratios
P/E ratios primarily reflect market expectations around earnings growth rates. That’s because companies that grow earnings per share quickly will rapidly increase the ‘E’ in the equation. Therefore, even if you pay a high multiple of earnings now, that multiple will become lower in the future. Then, a lower P/E should attract more buyers, pushing the share price up.
Advance NanoTek increased earnings per share by a whopping 290% last year. And earnings per share have improved by 76% annually, over the last five years. I’d therefore be a little surprised if its P/E ratio was not relatively high.
How Does Advance NanoTek’s P/E Ratio Compare To Its Peers?
The P/E ratio essentially measures market expectations of a company. As you can see below Advance NanoTek has a P/E ratio that is fairly close for the average for the chemicals industry, which is 27.5.
Advance NanoTek’s P/E tells us that market participants think its prospects are roughly in line with its industry. So if Advance NanoTek actually outperforms its peers going forward, that should be a positive for the share price. I inform my view byby checking management tenure and remuneration, among other things.
A Limitation: P/E Ratios Ignore Debt and Cash In The Bank
Don’t forget that the P/E ratio considers market capitalization. That means it doesn’t take debt or cash into account. Hypothetically, a company could reduce its future P/E ratio by spending its cash (or taking on debt) to achieve higher earnings.
Such expenditure might be good or bad, in the long term, but the point here is that the balance sheet is not reflected by this ratio.
Is Debt Impacting Advance NanoTek’s P/E?
The extra options and safety that comes with Advance NanoTek’s AU$1.4m net cash position means that it deserves a higher P/E than it would if it had a lot of net debt.
The Bottom Line On Advance NanoTek’s P/E Ratio
Advance NanoTek trades on a P/E ratio of 28.7, which is above the AU market average of 15.7. Its strong balance sheet gives the company plenty of resources for extra growth, and it has already proven it can grow. So it is not surprising the market is probably extrapolating recent growth well into the future, reflected in the relatively high P/E ratio.
When the market is wrong about a stock, it gives savvy investors an opportunity. If the reality for a company is better than it expects, you can make money by buying and holding for the long term. Although we don’t have analyst forecasts, you might want to assess this data-rich visualization of earnings, revenue and cash flow.
But note: Advance NanoTek may not be the best stock to buy. So take a peek at this free list of interesting companies with strong recent earnings growth (and a P/E ratio below 20).
To help readers see past the short term volatility of the financial market, we aim to bring you a long-term focused research analysis purely driven by fundamental data. Note that our analysis does not factor in the latest price-sensitive company announcements.
The author is an independent contributor and at the time of publication had no position in the stocks mentioned. For errors that warrant correction please contact the editor at editorial-team@simplywallst.com.
