
 Yahoo Finance
 WiseTech Global (ASX:WTC) Shareholders Have Enjoyed A Whopping 493% Share Price Gain
WiseTech Global Limited (ASX:WTC) shareholders have seen the share price descend 18% over the month. But that doesn't change the fact that the returns over the last half decade have been spectacular. Indeed, the share price is up a whopping 493% in that time. So it might be that some shareholders are taking profits after good performance. The most important thing for savvy investors to consider is whether the underlying business can justify the share price gain.
View our latest analysis for WiseTech Global
While the efficient markets hypothesis continues to be taught by some, it has been proven that markets are over-reactive dynamic systems, and investors are not always rational. One imperfect but simple way to consider how the market perception of a company has shifted is to compare the change in the earnings per share (EPS) with the share price movement.
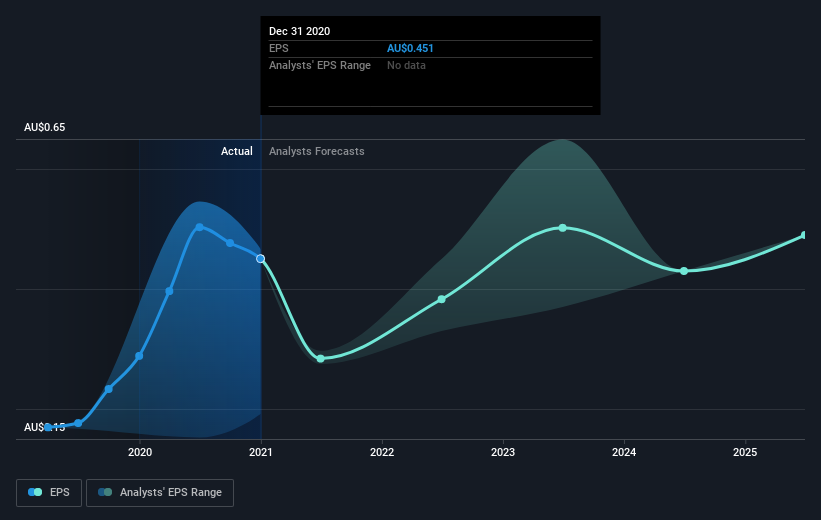
During five years of share price growth, WiseTech Global achieved compound earnings per share (EPS) growth of 68% per year. The EPS growth is more impressive than the yearly share price gain of 43% over the same period. Therefore, it seems the market has become relatively pessimistic about the company. Of course, with a P/E ratio of 57.93, the market remains optimistic.
The company's earnings per share (over time) is depicted in the image below (click to see the exact numbers).
It's probably worth noting we've seen significant insider buying in the last quarter, which we consider a positive. That said, we think earnings and revenue growth trends are even more important factors to consider. Dive deeper into the earnings by checking this interactive graph of WiseTech Global's earnings, revenue and cash flow.
What About Dividends?
As well as measuring the share price return, investors should also consider the total shareholder return (TSR). Whereas the share price return only reflects the change in the share price, the TSR includes the value of dividends (assuming they were reinvested) and the benefit of any discounted capital raising or spin-off. It's fair to say that the TSR gives a more complete picture for stocks that pay a dividend. In the case of WiseTech Global, it has a TSR of 499% for the last 5 years. That exceeds its share price return that we previously mentioned. And there's no prize for guessing that the dividend payments largely explain the divergence!
A Different Perspective
WiseTech Global provided a TSR of 25% over the last twelve months. Unfortunately this falls short of the market return. If we look back over five years, the returns are even better, coming in at 43% per year for five years. Maybe the share price is just taking a breather while the business executes on its growth strategy. While it is well worth considering the different impacts that market conditions can have on the share price, there are other factors that are even more important. For instance, we've identified 3 warning signs for WiseTech Global that you should be aware of.
WiseTech Global is not the only stock that insiders are buying. For those who like to find winning investments this free list of growing companies with recent insider purchasing, could be just the ticket.
Please note, the market returns quoted in this article reflect the market weighted average returns of stocks that currently trade on AU exchanges.
This article by Simply Wall St is general in nature. It does not constitute a recommendation to buy or sell any stock, and does not take account of your objectives, or your financial situation. We aim to bring you long-term focused analysis driven by fundamental data. Note that our analysis may not factor in the latest price-sensitive company announcements or qualitative material. Simply Wall St has no position in any stocks mentioned.
Have feedback on this article? Concerned about the content? Get in touch with us directly. Alternatively, email editorial-team (at) simplywallst.com.
