
 Yahoo Finance
 Why United Strength Power Holdings Limited (HKG:2337) May Not Be As Efficient As Its Industry

This article is intended for those of you who are at the beginning of your investing journey and want to start learning about core concepts of fundamental analysis on practical examples from today’s market.
United Strength Power Holdings Limited’s (HKG:2337) most recent return on equity was a substandard 9.0% relative to its industry performance of 10.8% over the past year. An investor may attribute an inferior ROE to a relatively inefficient performance, and whilst this can often be the case, knowing the nuts and bolts of the ROE calculation may change that perspective and give you a deeper insight into 2337’s past performance. Today I will look at how components such as financial leverage can influence ROE which may impact the sustainability of 2337’s returns.
Check out our latest analysis for United Strength Power Holdings
Breaking down Return on Equity
Return on Equity (ROE) is a measure of United Strength Power Holdings’s profit relative to its shareholders’ equity. An ROE of 9.0% implies HK$0.090 returned on every HK$1 invested. While a higher ROE is preferred in most cases, there are several other factors we should consider before drawing any conclusions.
Return on Equity = Net Profit ÷ Shareholders Equity
Returns are usually compared to costs to measure the efficiency of capital. United Strength Power Holdings’s cost of equity is 8.4%. Some of United Strength Power Holdings’s peers may have a higher ROE but its cost of equity could exceed this return, leading to an unsustainable negative discrepancy i.e. the company spends more than it earns. This is not the case for United Strength Power Holdings which is reassuring. ROE can be dissected into three distinct ratios: net profit margin, asset turnover, and financial leverage. This is called the Dupont Formula:
Dupont Formula
ROE = profit margin × asset turnover × financial leverage
ROE = (annual net profit ÷ sales) × (sales ÷ assets) × (assets ÷ shareholders’ equity)
ROE = annual net profit ÷ shareholders’ equity

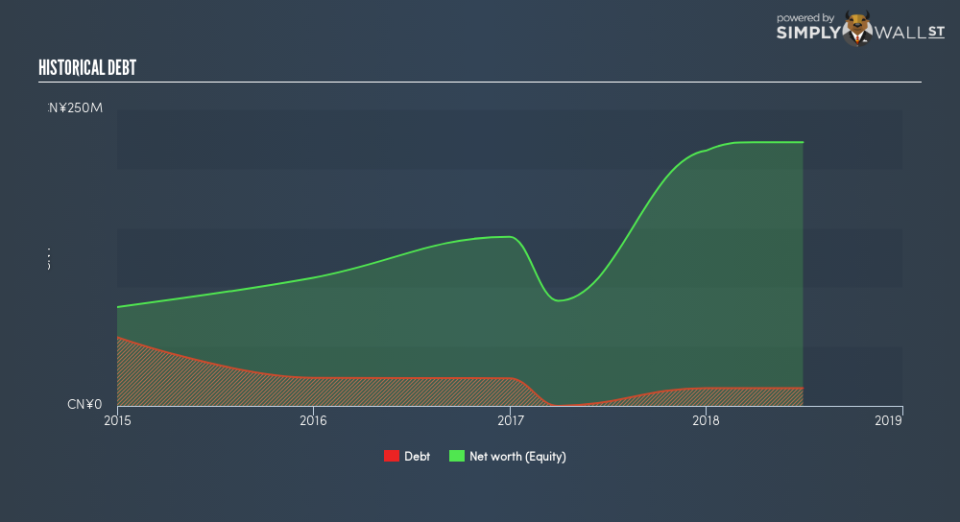
Essentially, profit margin shows how much money the company makes after paying for all its expenses. The other component, asset turnover, illustrates how much revenue United Strength Power Holdings can make from its asset base. The most interesting ratio, and reflective of sustainability of its ROE, is financial leverage. Since financial leverage can artificially inflate ROE, we need to look at how much debt United Strength Power Holdings currently has. At 6.8%, United Strength Power Holdings’s debt-to-equity ratio appears low and indicates that United Strength Power Holdings still has room to increase leverage and grow its profits.
Next Steps:
While ROE is a relatively simple calculation, it can be broken down into different ratios, each telling a different story about the strengths and weaknesses of a company. While United Strength Power Holdings exhibits a weak ROE against its peers, its returns are sufficient enough to cover its cost of equity. Its appropriate level of leverage means investors can be more confident in the sustainability of United Strength Power Holdings’s return with a possible increase should the company decide to increase its debt levels. Although ROE can be a useful metric, it is only a small part of diligent research.
For United Strength Power Holdings, I’ve compiled three fundamental factors you should look at:
Financial Health: Does it have a healthy balance sheet? Take a look at our free balance sheet analysis with six simple checks on key factors like leverage and risk.
Valuation: What is United Strength Power Holdings worth today? Is the stock undervalued, even when its growth outlook is factored into its intrinsic value? The intrinsic value infographic in our free research report helps visualize whether United Strength Power Holdings is currently mispriced by the market.
Other High-Growth Alternatives : Are there other high-growth stocks you could be holding instead of United Strength Power Holdings? Explore our interactive list of stocks with large growth potential to get an idea of what else is out there you may be missing!
To help readers see past the short term volatility of the financial market, we aim to bring you a long-term focused research analysis purely driven by fundamental data. Note that our analysis does not factor in the latest price-sensitive company announcements.
The author is an independent contributor and at the time of publication had no position in the stocks mentioned. For errors that warrant correction please contact the editor at editorial-team@simplywallst.com.
