
 Yahoo Finance
 Why TechnipFMC plc (NYSE:FTI) Is A Financially Healthy Company

Want to participate in a short research study? Help shape the future of investing tools and you could win a $250 gift card!
With a market capitalization of US$10b, TechnipFMC plc (NYSE:FTI) is a large-cap stock, which is considered by most investors as a safe bet. Common characteristics for these big stocks are their strong balance sheet and high liquidity, which means there’s plenty of stocks available to the public for trading. These companies are resilient in times of low liquidity and are not as strongly impacted by interest rate hikes as companies with lots of debt. Today I will analyse the latest financial data for FTI to determine is solvency and liquidity and whether the stock is a sound investment.
Check out our latest analysis for TechnipFMC
How much cash does FTI generate through its operations?
FTI has built up its total debt levels in the last twelve months, from US$3.6b to US$4.1b , which accounts for long term debt. With this rise in debt, the current cash and short-term investment levels stands at US$5.6b for investing into the business. Moving onto cash from operations, its small level of operating cash flow means calculating cash-to-debt wouldn’t be too useful, though these low levels of cash means that operational efficiency is worth a look. For this article’s sake, I won’t be looking at this today, but you can assess some of FTI’s operating efficiency ratios such as ROA here.
Can FTI pay its short-term liabilities?
With current liabilities at US$8.7b, it appears that the company has been able to meet these commitments with a current assets level of US$12b, leading to a 1.33x current account ratio. For Energy Services companies, this ratio is within a sensible range as there’s enough of a cash buffer without holding too much capital in low return investments.
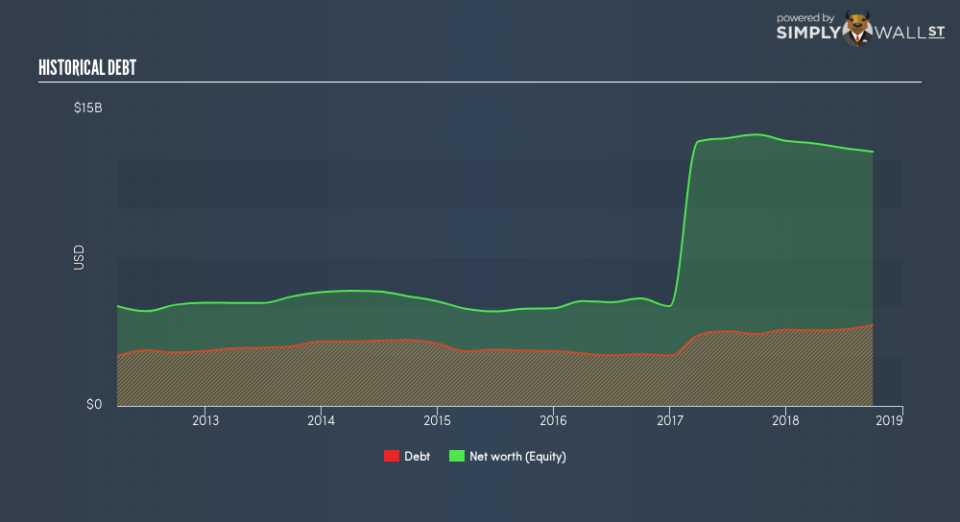
Does FTI face the risk of succumbing to its debt-load?
With debt at 32% of equity, FTI may be thought of as appropriately levered. FTI is not taking on too much debt commitment, which may be constraining for future growth. We can test if FTI’s debt levels are sustainable by measuring interest payments against earnings of a company. As a rule of thumb, a company should have earnings before interest and tax (EBIT) of at least three times the size of net interest. In FTI’s case, the ratio of 3.77x suggests that interest is appropriately covered. It is considered a responsible and reassuring practice to maintain high interest coverage, which makes FTI and other large-cap investments thought to be safe.
Next Steps:
FTI’s cash flow coverage indicates it could improve its operating efficiency in order to meet demand for debt repayments should unforeseen events arise. However, the company exhibits proper management of current assets and upcoming liabilities. I admit this is a fairly basic analysis for FTI’s financial health. Other important fundamentals need to be considered alongside. You should continue to research TechnipFMC to get a more holistic view of the stock by looking at:
Future Outlook: What are well-informed industry analysts predicting for FTI’s future growth? Take a look at our free research report of analyst consensus for FTI’s outlook.
Valuation: What is FTI worth today? Is the stock undervalued, even when its growth outlook is factored into its intrinsic value? The intrinsic value infographic in our free research report helps visualize whether FTI is currently mispriced by the market.
Other High-Performing Stocks: Are there other stocks that provide better prospects with proven track records? Explore our free list of these great stocks here.
To help readers see past the short term volatility of the financial market, we aim to bring you a long-term focused research analysis purely driven by fundamental data. Note that our analysis does not factor in the latest price-sensitive company announcements.
The author is an independent contributor and at the time of publication had no position in the stocks mentioned. For errors that warrant correction please contact the editor at editorial-team@simplywallst.com.
