
 Yahoo Finance
 Why Tech Data Corporation’s (NASDAQ:TECD) Return On Capital Employed Is Impressive

Today we'll evaluate Tech Data Corporation (NASDAQ:TECD) to determine whether it could have potential as an investment idea. Specifically, we'll consider its Return On Capital Employed (ROCE), since that will give us an insight into how efficiently the business can generate profits from the capital it requires.
First up, we'll look at what ROCE is and how we calculate it. Then we'll compare its ROCE to similar companies. Finally, we'll look at how its current liabilities affect its ROCE.
What is Return On Capital Employed (ROCE)?
ROCE measures the 'return' (pre-tax profit) a company generates from capital employed in its business. Generally speaking a higher ROCE is better. Overall, it is a valuable metric that has its flaws. Renowned investment researcher Michael Mauboussin has suggested that a high ROCE can indicate that 'one dollar invested in the company generates value of more than one dollar'.
So, How Do We Calculate ROCE?
The formula for calculating the return on capital employed is:
Return on Capital Employed = Earnings Before Interest and Tax (EBIT) ÷ (Total Assets - Current Liabilities)
Or for Tech Data:
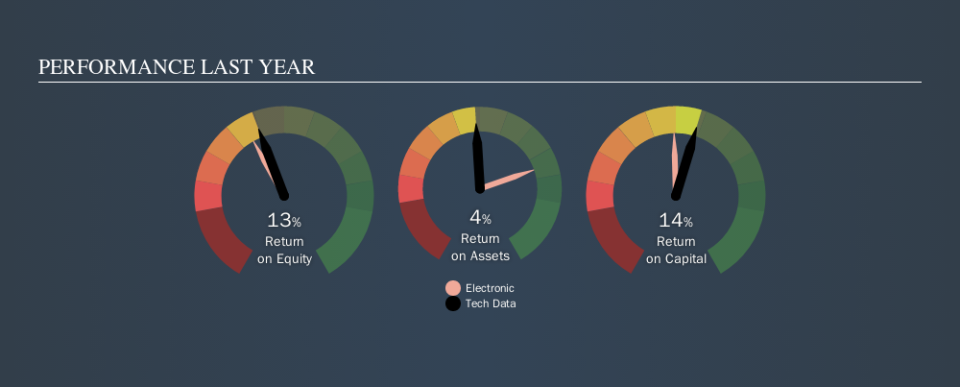
0.14 = US$628m ÷ (US$12b - US$7.6b) (Based on the trailing twelve months to July 2019.)
Therefore, Tech Data has an ROCE of 14%.
Check out our latest analysis for Tech Data
Does Tech Data Have A Good ROCE?
When making comparisons between similar businesses, investors may find ROCE useful. Using our data, we find that Tech Data's ROCE is meaningfully better than the 12% average in the Electronic industry. We consider this a positive sign, because it suggests it uses capital more efficiently than similar companies. Independently of how Tech Data compares to its industry, its ROCE in absolute terms appears decent, and the company may be worthy of closer investigation.
You can click on the image below to see (in greater detail) how Tech Data's past growth compares to other companies.
Remember that this metric is backwards looking - it shows what has happened in the past, and does not accurately predict the future. Companies in cyclical industries can be difficult to understand using ROCE, as returns typically look high during boom times, and low during busts. This is because ROCE only looks at one year, instead of considering returns across a whole cycle. What happens in the future is pretty important for investors, so we have prepared a free report on analyst forecasts for Tech Data.
What Are Current Liabilities, And How Do They Affect Tech Data's ROCE?
Liabilities, such as supplier bills and bank overdrafts, are referred to as current liabilities if they need to be paid within 12 months. Due to the way ROCE is calculated, a high level of current liabilities makes a company look as though it has less capital employed, and thus can (sometimes unfairly) boost the ROCE. To counteract this, we check if a company has high current liabilities, relative to its total assets.
Tech Data has total liabilities of US$7.6b and total assets of US$12b. As a result, its current liabilities are equal to approximately 63% of its total assets. Tech Data has a relatively high level of current liabilities, boosting its ROCE meaningfully.
Our Take On Tech Data's ROCE
This ROCE is pretty good, but remember that it would look less impressive with fewer current liabilities. Tech Data looks strong on this analysis, but there are plenty of other companies that could be a good opportunity . Here is a free list of companies growing earnings rapidly.
If you are like me, then you will not want to miss this free list of growing companies that insiders are buying.
We aim to bring you long-term focused research analysis driven by fundamental data. Note that our analysis may not factor in the latest price-sensitive company announcements or qualitative material.
If you spot an error that warrants correction, please contact the editor at editorial-team@simplywallst.com. This article by Simply Wall St is general in nature. It does not constitute a recommendation to buy or sell any stock, and does not take account of your objectives, or your financial situation. Simply Wall St has no position in the stocks mentioned. Thank you for reading.
