
 Yahoo Finance
 Why We Like The Returns At Liquidity Services (NASDAQ:LQDT)
What trends should we look for it we want to identify stocks that can multiply in value over the long term? Ideally, a business will show two trends; firstly a growing return on capital employed (ROCE) and secondly, an increasing amount of capital employed. Basically this means that a company has profitable initiatives that it can continue to reinvest in, which is a trait of a compounding machine. So when we looked at the ROCE trend of Liquidity Services (NASDAQ:LQDT) we really liked what we saw.
What Is Return On Capital Employed (ROCE)?
If you haven't worked with ROCE before, it measures the 'return' (pre-tax profit) a company generates from capital employed in its business. The formula for this calculation on Liquidity Services is:
Return on Capital Employed = Earnings Before Interest and Tax (EBIT) ÷ (Total Assets - Current Liabilities)
0.20 = US$29m ÷ (US$277m - US$133m) (Based on the trailing twelve months to March 2022).
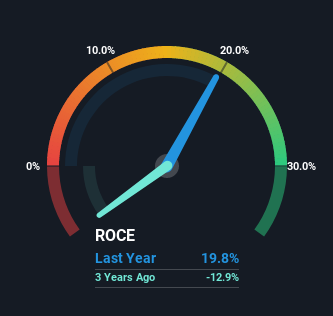
So, Liquidity Services has an ROCE of 20%. That's a fantastic return and not only that, it outpaces the average of 11% earned by companies in a similar industry.
View our latest analysis for Liquidity Services
Above you can see how the current ROCE for Liquidity Services compares to its prior returns on capital, but there's only so much you can tell from the past. If you'd like to see what analysts are forecasting going forward, you should check out our free report for Liquidity Services.
So How Is Liquidity Services' ROCE Trending?
Shareholders will be relieved that Liquidity Services has broken into profitability. While the business was unprofitable in the past, it's now turned things around and is earning 20% on its capital. On top of that, what's interesting is that the amount of capital being employed has remained steady, so the business hasn't needed to put any additional money to work to generate these higher returns. That being said, while an increase in efficiency is no doubt appealing, it'd be helpful to know if the company does have any investment plans going forward. After all, a company can only become a long term multi-bagger if it continually reinvests in itself at high rates of return.
On a side note, we noticed that the improvement in ROCE appears to be partly fueled by an increase in current liabilities. Effectively this means that suppliers or short-term creditors are now funding 48% of the business, which is more than it was five years ago. And with current liabilities at those levels, that's pretty high.
Our Take On Liquidity Services' ROCE
As discussed above, Liquidity Services appears to be getting more proficient at generating returns since capital employed has remained flat but earnings (before interest and tax) are up. Since the stock has returned a staggering 273% to shareholders over the last five years, it looks like investors are recognizing these changes. In light of that, we think it's worth looking further into this stock because if Liquidity Services can keep these trends up, it could have a bright future ahead.
One more thing to note, we've identified 2 warning signs with Liquidity Services and understanding these should be part of your investment process.
If you'd like to see other companies earning high returns, check out our free list of companies earning high returns with solid balance sheets here.
Have feedback on this article? Concerned about the content? Get in touch with us directly. Alternatively, email editorial-team (at) simplywallst.com.
This article by Simply Wall St is general in nature. We provide commentary based on historical data and analyst forecasts only using an unbiased methodology and our articles are not intended to be financial advice. It does not constitute a recommendation to buy or sell any stock, and does not take account of your objectives, or your financial situation. We aim to bring you long-term focused analysis driven by fundamental data. Note that our analysis may not factor in the latest price-sensitive company announcements or qualitative material. Simply Wall St has no position in any stocks mentioned.
Join A Paid User Research Session
You’ll receive a US$30 Amazon Gift card for 1 hour of your time while helping us build better investing tools for the individual investors like yourself. Sign up here
