
 Yahoo Finance
 Why We’re Not Keen On Ctrip.com International, Ltd.’s (NASDAQ:CTRP) 2.2% Return On Capital

Today we'll look at Ctrip.com International, Ltd. (NASDAQ:CTRP) and reflect on its potential as an investment. In particular, we'll consider its Return On Capital Employed (ROCE), as that can give us insight into how profitably the company is able to employ capital in its business.
First, we'll go over how we calculate ROCE. Second, we'll look at its ROCE compared to similar companies. Then we'll determine how its current liabilities are affecting its ROCE.
What is Return On Capital Employed (ROCE)?
ROCE measures the 'return' (pre-tax profit) a company generates from capital employed in its business. In general, businesses with a higher ROCE are usually better quality. Overall, it is a valuable metric that has its flaws. Renowned investment researcher Michael Mauboussin has suggested that a high ROCE can indicate that 'one dollar invested in the company generates value of more than one dollar'.
How Do You Calculate Return On Capital Employed?
The formula for calculating the return on capital employed is:
Return on Capital Employed = Earnings Before Interest and Tax (EBIT) ÷ (Total Assets - Current Liabilities)
Or for Ctrip.com International:
0.022 = CN¥2.6b ÷ (CN¥186b - CN¥69b) (Based on the trailing twelve months to December 2018.)
So, Ctrip.com International has an ROCE of 2.2%.
See our latest analysis for Ctrip.com International
Does Ctrip.com International Have A Good ROCE?
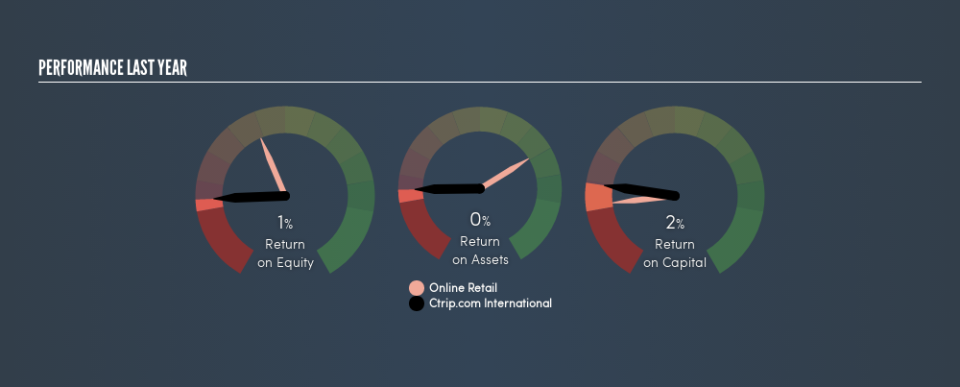
ROCE can be useful when making comparisons, such as between similar companies. In this analysis, Ctrip.com International's ROCE appears meaningfully below the 10% average reported by the Online Retail industry. This performance is not ideal, as it suggests the company may not be deploying its capital as effectively as some competitors. Putting aside Ctrip.com International's performance relative to its industry, its ROCE in absolute terms is poor - considering the risk of owning stocks compared to government bonds. Readers may wish to look for more rewarding investments.
As we can see, Ctrip.com International currently has an ROCE of 2.2% compared to its ROCE 3 years ago, which was 0.4%. This makes us think about whether the company has been reinvesting shrewdly.
Remember that this metric is backwards looking - it shows what has happened in the past, and does not accurately predict the future. ROCE can be deceptive for cyclical businesses, as returns can look incredible in boom times, and terribly low in downturns. This is because ROCE only looks at one year, instead of considering returns across a whole cycle. What happens in the future is pretty important for investors, so we have prepared a free report on analyst forecasts for Ctrip.com International.
What Are Current Liabilities, And How Do They Affect Ctrip.com International's ROCE?
Liabilities, such as supplier bills and bank overdrafts, are referred to as current liabilities if they need to be paid within 12 months. The ROCE equation subtracts current liabilities from capital employed, so a company with a lot of current liabilities appears to have less capital employed, and a higher ROCE than otherwise. To check the impact of this, we calculate if a company has high current liabilities relative to its total assets.
Ctrip.com International has total assets of CN¥186b and current liabilities of CN¥69b. As a result, its current liabilities are equal to approximately 37% of its total assets. Ctrip.com International has a medium level of current liabilities (boosting the ROCE somewhat), and a low ROCE.
Our Take On Ctrip.com International's ROCE
So researching other companies may be a better use of your time. Of course, you might also be able to find a better stock than Ctrip.com International. So you may wish to see this free collection of other companies that have grown earnings strongly.
If you are like me, then you will not want to miss this free list of growing companies that insiders are buying.
We aim to bring you long-term focused research analysis driven by fundamental data. Note that our analysis may not factor in the latest price-sensitive company announcements or qualitative material.
If you spot an error that warrants correction, please contact the editor at editorial-team@simplywallst.com. This article by Simply Wall St is general in nature. It does not constitute a recommendation to buy or sell any stock, and does not take account of your objectives, or your financial situation. Simply Wall St has no position in the stocks mentioned. Thank you for reading.
