
 Yahoo Finance
 Why We’re Not Impressed By XTEK Limited’s (ASX:XTE) 1.2% ROCE

Today we'll look at XTEK Limited (ASX:XTE) and reflect on its potential as an investment. Specifically, we'll consider its Return On Capital Employed (ROCE), since that will give us an insight into how efficiently the business can generate profits from the capital it requires.
First of all, we'll work out how to calculate ROCE. Next, we'll compare it to others in its industry. Last but not least, we'll look at what impact its current liabilities have on its ROCE.
Understanding Return On Capital Employed (ROCE)
ROCE measures the 'return' (pre-tax profit) a company generates from capital employed in its business. Generally speaking a higher ROCE is better. Overall, it is a valuable metric that has its flaws. Renowned investment researcher Michael Mauboussin has suggested that a high ROCE can indicate that 'one dollar invested in the company generates value of more than one dollar'.
So, How Do We Calculate ROCE?
The formula for calculating the return on capital employed is:
Return on Capital Employed = Earnings Before Interest and Tax (EBIT) ÷ (Total Assets - Current Liabilities)
Or for XTEK:
0.012 = AU$114k ÷ (AU$30m - AU$21m) (Based on the trailing twelve months to June 2019.)
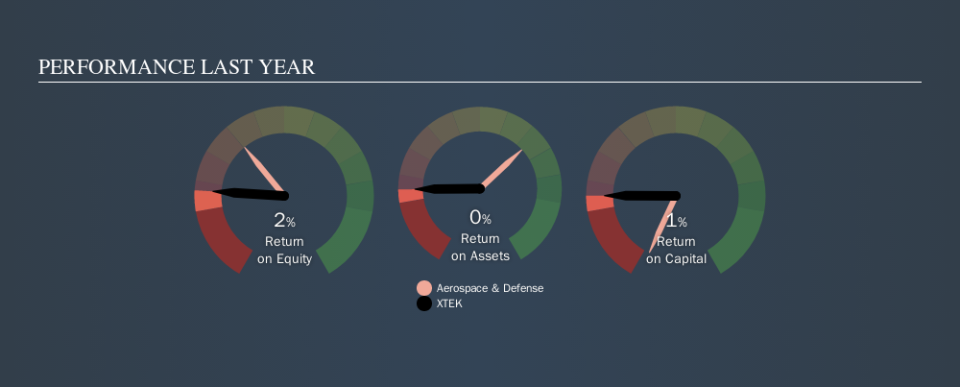
So, XTEK has an ROCE of 1.2%.
See our latest analysis for XTEK
Does XTEK Have A Good ROCE?
One way to assess ROCE is to compare similar companies. We can see XTEK's ROCE is meaningfully below the Aerospace & Defense industry average of 9.4%. This could be seen as a negative, as it suggests some competitors may be employing their capital more efficiently. Independently of how XTEK compares to its industry, its ROCE in absolute terms is low; especially compared to the ~2.3% available in government bonds. It is likely that there are more attractive prospects out there.
XTEK reported an ROCE of 1.2% -- better than 3 years ago, when the company didn't make a profit. That implies the business has been improving. You can click on the image below to see (in greater detail) how XTEK's past growth compares to other companies.
Remember that this metric is backwards looking - it shows what has happened in the past, and does not accurately predict the future. ROCE can be deceptive for cyclical businesses, as returns can look incredible in boom times, and terribly low in downturns. ROCE is only a point-in-time measure. You can check if XTEK has cyclical profits by looking at this free graph of past earnings, revenue and cash flow.
How XTEK's Current Liabilities Impact Its ROCE
Current liabilities are short term bills and invoices that need to be paid in 12 months or less. Due to the way ROCE is calculated, a high level of current liabilities makes a company look as though it has less capital employed, and thus can (sometimes unfairly) boost the ROCE. To check the impact of this, we calculate if a company has high current liabilities relative to its total assets.
XTEK has total liabilities of AU$21m and total assets of AU$30m. As a result, its current liabilities are equal to approximately 69% of its total assets. XTEK has a fairly high level of current liabilities, boosting its ROCE.
Our Take On XTEK's ROCE
Unfortunately, its ROCE is also pretty low, so we are cautious about the stock. Of course, you might also be able to find a better stock than XTEK. So you may wish to see this free collection of other companies that have grown earnings strongly.
For those who like to find winning investments this free list of growing companies with recent insider purchasing, could be just the ticket.
We aim to bring you long-term focused research analysis driven by fundamental data. Note that our analysis may not factor in the latest price-sensitive company announcements or qualitative material.
If you spot an error that warrants correction, please contact the editor at editorial-team@simplywallst.com. This article by Simply Wall St is general in nature. It does not constitute a recommendation to buy or sell any stock, and does not take account of your objectives, or your financial situation. Simply Wall St has no position in the stocks mentioned. Thank you for reading.
