
 Yahoo Finance
 Why National Presto Industries, Inc.’s (NYSE:NPK) Return On Capital Employed Is Impressive

Want to participate in a short research study? Help shape the future of investing tools and receive a $20 prize!
Today we’ll look at National Presto Industries, Inc. (NYSE:NPK) and reflect on its potential as an investment. Specifically, we’ll consider its Return On Capital Employed (ROCE), since that will give us an insight into how efficiently the business can generate profits from the capital it requires.
First, we’ll go over how we calculate ROCE. Next, we’ll compare it to others in its industry. And finally, we’ll look at how its current liabilities are impacting its ROCE.
Understanding Return On Capital Employed (ROCE)
ROCE is a measure of a company’s yearly pre-tax profit (its return), relative to the capital employed in the business. In general, businesses with a higher ROCE are usually better quality. In brief, it is a useful tool, but it is not without drawbacks. Author Edwin Whiting says to be careful when comparing the ROCE of different businesses, since ‘No two businesses are exactly alike.’
How Do You Calculate Return On Capital Employed?
The formula for calculating the return on capital employed is:
Return on Capital Employed = Earnings Before Interest and Tax (EBIT) ÷ (Total Assets – Current Liabilities)
Or for National Presto Industries:
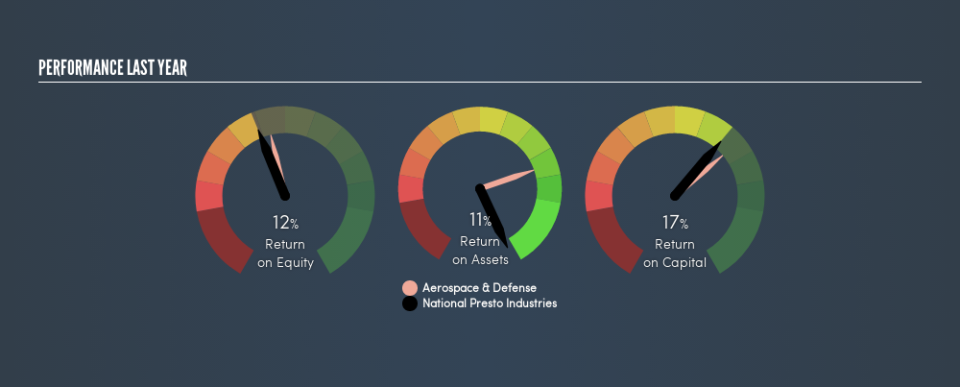
0.17 = US$62m ÷ (US$404m – US$50m) (Based on the trailing twelve months to September 2018.)
So, National Presto Industries has an ROCE of 17%.
View our latest analysis for National Presto Industries
Does National Presto Industries Have A Good ROCE?
ROCE is commonly used for comparing the performance of similar businesses. National Presto Industries’s ROCE appears to be substantially greater than the 12% average in the Aerospace & Defense industry. I think that’s good to see, since it implies the company is better than other companies at making the most of its capital. Regardless of where National Presto Industries sits next to its industry, its ROCE in absolute terms appears satisfactory, and this company could be worth a closer look.
When considering this metric, keep in mind that it is backwards looking, and not necessarily predictive. ROCE can be misleading for companies in cyclical industries, with returns looking impressive during the boom times, but very weak during the busts. This is because ROCE only looks at one year, instead of considering returns across a whole cycle. If National Presto Industries is cyclical, it could make sense to check out this free graph of past earnings, revenue and cash flow.
How National Presto Industries’s Current Liabilities Impact Its ROCE
Current liabilities are short term bills and invoices that need to be paid in 12 months or less. The ROCE equation subtracts current liabilities from capital employed, so a company with a lot of current liabilities appears to have less capital employed, and a higher ROCE than otherwise. To counteract this, we check if a company has high current liabilities, relative to its total assets.
National Presto Industries has total assets of US$404m and current liabilities of US$50m. As a result, its current liabilities are equal to approximately 12% of its total assets. Low current liabilities are not boosting the ROCE too much.
The Bottom Line On National Presto Industries’s ROCE
Overall, National Presto Industries has a decent ROCE and could be worthy of further research. Of course you might be able to find a better stock than National Presto Industries. So you may wish to see this free collection of other companies that have grown earnings strongly.
If you like to buy stocks alongside management, then you might just love this free list of companies. (Hint: insiders have been buying them).
We aim to bring you long-term focused research analysis driven by fundamental data. Note that our analysis may not factor in the latest price-sensitive company announcements or qualitative material.
If you spot an error that warrants correction, please contact the editor at editorial-team@simplywallst.com. This article by Simply Wall St is general in nature. It does not constitute a recommendation to buy or sell any stock, and does not take account of your objectives, or your financial situation. Simply Wall St has no position in the stocks mentioned. On rare occasion, data errors may occur. Thank you for reading.
