
 Yahoo Finance
 Why Investors Shouldn't Be Surprised By Helios Towers plc's (LON:HTWS) P/S
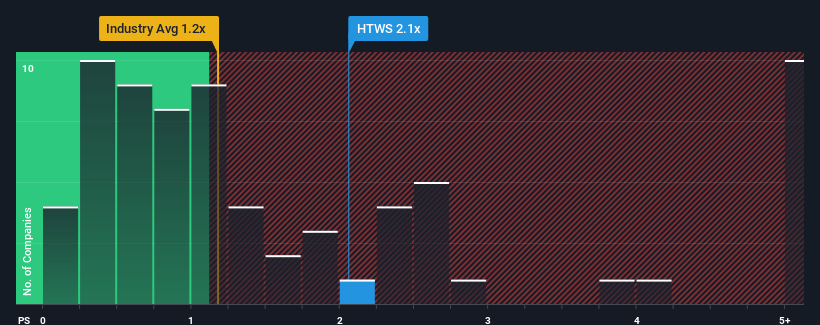
When you see that almost half of the companies in the Telecom industry in the United Kingdom have price-to-sales ratios (or "P/S") below 0.8x, Helios Towers plc (LON:HTWS) looks to be giving off some sell signals with its 2.1x P/S ratio. Nonetheless, we'd need to dig a little deeper to determine if there is a rational basis for the elevated P/S.
See our latest analysis for Helios Towers
How Has Helios Towers Performed Recently?
Helios Towers certainly has been doing a good job lately as its revenue growth has been positive while most other companies have been seeing their revenue go backwards. Perhaps the market is expecting the company's future revenue growth to buck the trend of the industry, contributing to a higher P/S. If not, then existing shareholders might be a little nervous about the viability of the share price.
Want the full picture on analyst estimates for the company? Then our free report on Helios Towers will help you uncover what's on the horizon.
How Is Helios Towers' Revenue Growth Trending?
Helios Towers' P/S ratio would be typical for a company that's expected to deliver solid growth, and importantly, perform better than the industry.
Taking a look back first, we see that the company grew revenue by an impressive 25% last year. Pleasingly, revenue has also lifted 45% in aggregate from three years ago, thanks to the last 12 months of growth. Accordingly, shareholders would have definitely welcomed those medium-term rates of revenue growth.
Shifting to the future, estimates from the seven analysts covering the company suggest revenue should grow by 13% per annum over the next three years. With the industry only predicted to deliver 2.5% each year, the company is positioned for a stronger revenue result.
In light of this, it's understandable that Helios Towers' P/S sits above the majority of other companies. It seems most investors are expecting this strong future growth and are willing to pay more for the stock.
What We Can Learn From Helios Towers' P/S?
Typically, we'd caution against reading too much into price-to-sales ratios when settling on investment decisions, though it can reveal plenty about what other market participants think about the company.
As we suspected, our examination of Helios Towers' analyst forecasts revealed that its superior revenue outlook is contributing to its high P/S. At this stage investors feel the potential for a deterioration in revenues is quite remote, justifying the elevated P/S ratio. Unless these conditions change, they will continue to provide strong support to the share price.
It is also worth noting that we have found 1 warning sign for Helios Towers that you need to take into consideration.
If these risks are making you reconsider your opinion on Helios Towers, explore our interactive list of high quality stocks to get an idea of what else is out there.
Have feedback on this article? Concerned about the content? Get in touch with us directly. Alternatively, email editorial-team (at) simplywallst.com.
This article by Simply Wall St is general in nature. We provide commentary based on historical data and analyst forecasts only using an unbiased methodology and our articles are not intended to be financial advice. It does not constitute a recommendation to buy or sell any stock, and does not take account of your objectives, or your financial situation. We aim to bring you long-term focused analysis driven by fundamental data. Note that our analysis may not factor in the latest price-sensitive company announcements or qualitative material. Simply Wall St has no position in any stocks mentioned.
Join A Paid User Research Session
You’ll receive a US$30 Amazon Gift card for 1 hour of your time while helping us build better investing tools for the individual investors like yourself. Sign up here
