
 Yahoo Finance
 Why Intermin Resources Ltd's (ASX:IRC) High P/E Ratio Isn't Necessarily A Bad Thing

Want to participate in a research study? Help shape the future of investing tools and earn a $60 gift card!
This article is written for those who want to get better at using price to earnings ratios (P/E ratios). We'll show how you can use Intermin Resources Ltd's (ASX:IRC) P/E ratio to inform your assessment of the investment opportunity. Intermin Resources has a price to earnings ratio of 25.88, based on the last twelve months. That means that at current prices, buyers pay A$25.88 for every A$1 in trailing yearly profits.
View our latest analysis for Intermin Resources
How Do You Calculate A P/E Ratio?
The formula for P/E is:
Price to Earnings Ratio = Price per Share ÷ Earnings per Share (EPS)
Or for Intermin Resources:
P/E of 25.88 = A$0.13 ÷ A$0.0050 (Based on the trailing twelve months to December 2018.)
Is A High P/E Ratio Good?
A higher P/E ratio means that buyers have to pay a higher price for each A$1 the company has earned over the last year. All else being equal, it's better to pay a low price -- but as Warren Buffett said, 'It's far better to buy a wonderful company at a fair price than a fair company at a wonderful price.'
How Growth Rates Impact P/E Ratios
Probably the most important factor in determining what P/E a company trades on is the earnings growth. That's because companies that grow earnings per share quickly will rapidly increase the 'E' in the equation. Therefore, even if you pay a high multiple of earnings now, that multiple will become lower in the future. So while a stock may look expensive based on past earnings, it could be cheap based on future earnings.
Intermin Resources shrunk earnings per share by 61% over the last year. But it has grown its earnings per share by 11% per year over the last five years.
How Does Intermin Resources's P/E Ratio Compare To Its Peers?
The P/E ratio essentially measures market expectations of a company. You can see in the image below that the average P/E (13.3) for companies in the metals and mining industry is lower than Intermin Resources's P/E.
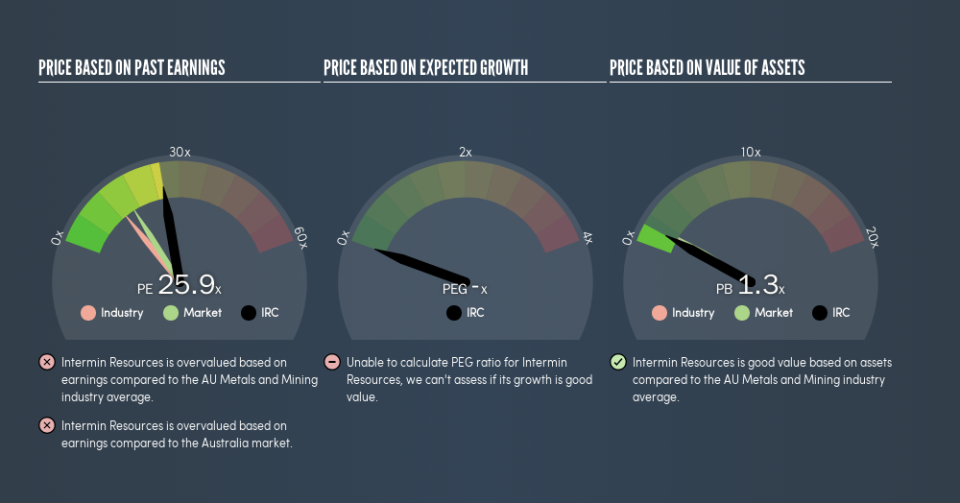
Intermin Resources's P/E tells us that market participants think the company will perform better than its industry peers, going forward. Clearly the market expects growth, but it isn't guaranteed. So investors should always consider the P/E ratio alongside other factors, such as whether company directors have been buying shares.
Remember: P/E Ratios Don't Consider The Balance Sheet
The 'Price' in P/E reflects the market capitalization of the company. In other words, it does not consider any debt or cash that the company may have on the balance sheet. In theory, a company can lower its future P/E ratio by using cash or debt to invest in growth.
Such expenditure might be good or bad, in the long term, but the point here is that the balance sheet is not reflected by this ratio.
Intermin Resources's Balance Sheet
Intermin Resources has net cash of AU$6.3m. That should lead to a higher P/E than if it did have debt, because its strong balance sheets gives it more options.
The Verdict On Intermin Resources's P/E Ratio
Intermin Resources has a P/E of 25.9. That's higher than the average in the AU market, which is 16.2. The recent drop in earnings per share might keep value investors away, but the relatively strong balance sheet will allow the company time to invest in growth. Clearly, the high P/E indicates shareholders think it will!
Investors should be looking to buy stocks that the market is wrong about. If the reality for a company is better than it expects, you can make money by buying and holding for the long term. Although we don't have analyst forecasts, you could get a better understanding of its growth by checking out this more detailed historical graph of earnings, revenue and cash flow.
You might be able to find a better buy than Intermin Resources. If you want a selection of possible winners, check out this free list of interesting companies that trade on a P/E below 20 (but have proven they can grow earnings).
We aim to bring you long-term focused research analysis driven by fundamental data. Note that our analysis may not factor in the latest price-sensitive company announcements or qualitative material.
If you spot an error that warrants correction, please contact the editor at editorial-team@simplywallst.com. This article by Simply Wall St is general in nature. It does not constitute a recommendation to buy or sell any stock, and does not take account of your objectives, or your financial situation. Simply Wall St has no position in the stocks mentioned. Thank you for reading.
