
 Yahoo Finance
 Why These Fundamentals Make National Australia Bank Limited’s (ASX:NAB) More Attractive

National Australia Bank Limited (ASX:NAB) is a large-cap stock operating in the financial services sector with a market cap of AU$71.61B. As major financial institutions return to health after the Global Financial Crisis, we are seeing an increase in market confidence, and understanding of, these “too-big-to-fail” banking stocks. Following the crisis, a set of reforms termed Basel III was enforced to bolster risk management, regulation, and supervision in the financial services industry. These reforms target banking regulations and intends to enhance financial institutions’ ability to absorb shocks resulting from economic stress which could expose banks to vulnerabilities. Operating in AU, NAB is held to strict regulation which focus investor attention to the type and level of risk it takes on. Investors are viewing NAB with a more cautious lens and analysing these stocks using bank-specific metrics such as liquidity and leverage. Today we’re going to take a look at these metrics to gain more confidence investing in the stock. View our latest analysis for National Australia Bank
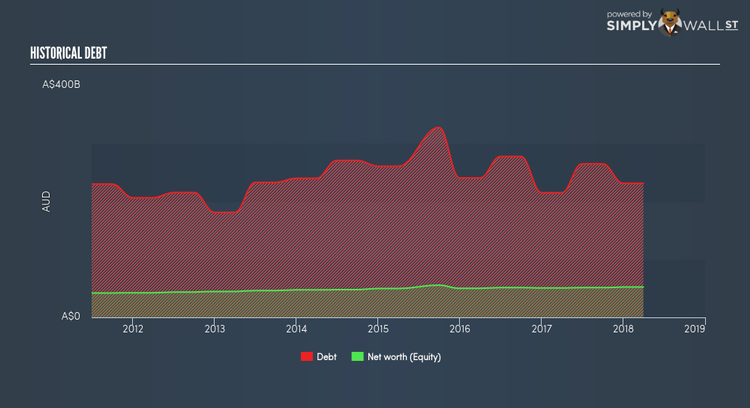
Why Does NAB’s Leverage Matter?
Banks with low leverage are better positioned to weather adverse headwinds as they have less debt to pay off. A bank’s leverage may be thought of as the level of assets it owns compared to its own shareholders’ equity. Financial institutions are required to have a certain level of buffer to meet capital adequacy levels. National Australia Bank’s leverage level of less than the suitable maximum level of 20x, at 15x, is considered to be very cautious and prudent. This means the bank exhibits very strong leverage management and is well-positioned to repay its debtors in the case of any adverse events since it has an appropriately high level of equity relative to the debt it has taken on to remain in business. If the bank needs to firm up its capital cushion, it has ample headroom to increase its debt level without deteriorating its financial position.
How Should We Measure NAB’s Liquidity?

As I eluded to above, loans are relatively illiquid. It’s helpful to understand how much of this illiquid asset makes up National Australia Bank’s total asset. Generally, they should make up less than 70% of total assets, however its current level of 70.63% means the bank has lent out 1% above the sensible threshold. This indicates that revenue is dependent on this particular asset but also the bank is more exposed to defaulting relative to banks with less loans.
What is NAB’s Liquidity Discrepancy?
Banks profit by lending out its customers’ deposits as loans and charge an interest on the principle. Loans are generally fixed term which means they cannot be readily realized, however, customer deposits are liabilities which must be repaid on-demand and in short notice. The disparity between the immediacy of deposits compared to the illiquid nature of loans puts pressure on the bank’s financial position if an adverse event requires the bank to repay its depositors. Relative to the prudent industry loan to deposit level of 90%, National Australia Bank’s ratio of over 111.84% is higher, which puts the bank in a risky position due to the negative liquidity disparity between loan and deposit levels. Essentially, for A$1 of deposits with the bank, it lends out more than A$1 which is unsustainable.
Next Steps:
Keep in mind that a stock investment requires research on more than just its operational side. Below, I’ve compiled three key aspects you should further research:
Future Outlook: What are well-informed industry analysts predicting for NAB’s future growth? Take a look at our free research report of analyst consensus for NAB’s outlook.
Valuation: What is NAB worth today? Has the future growth potential already been factored into the price? The intrinsic value infographic in our free research report helps visualize whether NAB is currently mispriced by the market.
Other High-Performing Stocks: Are there other stocks that provide better prospects with proven track records? Explore our free list of these great stocks here.
To help readers see pass the short term volatility of the financial market, we aim to bring you a long-term focused research analysis purely driven by fundamental data. Note that our analysis does not factor in the latest price sensitive company announcements.
The author is an independent contributor and at the time of publication had no position in the stocks mentioned.
