
 Yahoo Finance
 Why Digi International Inc.’s (NASDAQ:DGII) Return On Capital Employed Might Be A Concern

Today we'll look at Digi International Inc. (NASDAQ:DGII) and reflect on its potential as an investment. In particular, we'll consider its Return On Capital Employed (ROCE), as that can give us insight into how profitably the company is able to employ capital in its business.
First, we'll go over how we calculate ROCE. Next, we'll compare it to others in its industry. Finally, we'll look at how its current liabilities affect its ROCE.
Return On Capital Employed (ROCE): What is it?
ROCE measures the 'return' (pre-tax profit) a company generates from capital employed in its business. In general, businesses with a higher ROCE are usually better quality. Overall, it is a valuable metric that has its flaws. Author Edwin Whiting says to be careful when comparing the ROCE of different businesses, since 'No two businesses are exactly alike.
So, How Do We Calculate ROCE?
The formula for calculating the return on capital employed is:
Return on Capital Employed = Earnings Before Interest and Tax (EBIT) ÷ (Total Assets - Current Liabilities)
Or for Digi International:
0.038 = US$13m ÷ (US$385m - US$35m) (Based on the trailing twelve months to June 2019.)
So, Digi International has an ROCE of 3.8%.
Check out our latest analysis for Digi International
Is Digi International's ROCE Good?
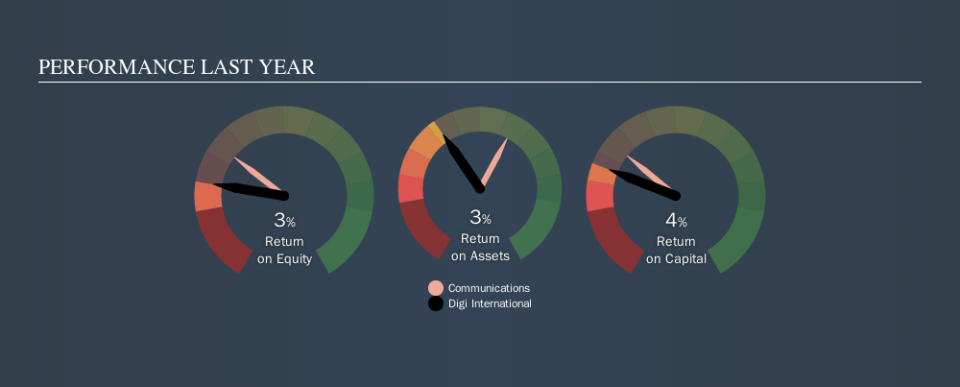
When making comparisons between similar businesses, investors may find ROCE useful. Using our data, Digi International's ROCE appears to be significantly below the 6.6% average in the Communications industry. This performance could be negative if sustained, as it suggests the business may underperform its industry. Regardless of how Digi International stacks up against its industry, its ROCE in absolute terms is quite low (especially compared to a bank account). Readers may wish to look for more rewarding investments.
We can see that, Digi International currently has an ROCE of 3.8%, less than the 6.0% it reported 3 years ago. This makes us wonder if the business is facing new challenges. You can see in the image below how Digi International's ROCE compares to its industry. Click to see more on past growth.
When considering this metric, keep in mind that it is backwards looking, and not necessarily predictive. Companies in cyclical industries can be difficult to understand using ROCE, as returns typically look high during boom times, and low during busts. ROCE is only a point-in-time measure. What happens in the future is pretty important for investors, so we have prepared a free report on analyst forecasts for Digi International.
Digi International's Current Liabilities And Their Impact On Its ROCE
Current liabilities include invoices, such as supplier payments, short-term debt, or a tax bill, that need to be paid within 12 months. Due to the way the ROCE equation works, having large bills due in the near term can make it look as though a company has less capital employed, and thus a higher ROCE than usual. To counter this, investors can check if a company has high current liabilities relative to total assets.
Digi International has total liabilities of US$35m and total assets of US$385m. As a result, its current liabilities are equal to approximately 9.1% of its total assets. Digi International has very few current liabilities, which have a minimal effect on its already low ROCE.
What We Can Learn From Digi International's ROCE
Nonetheless, there may be better places to invest your capital. Of course, you might find a fantastic investment by looking at a few good candidates. So take a peek at this free list of companies with modest (or no) debt, trading on a P/E below 20.
For those who like to find winning investments this free list of growing companies with recent insider purchasing, could be just the ticket.
We aim to bring you long-term focused research analysis driven by fundamental data. Note that our analysis may not factor in the latest price-sensitive company announcements or qualitative material.
If you spot an error that warrants correction, please contact the editor at editorial-team@simplywallst.com. This article by Simply Wall St is general in nature. It does not constitute a recommendation to buy or sell any stock, and does not take account of your objectives, or your financial situation. Simply Wall St has no position in the stocks mentioned. Thank you for reading.
