
 Yahoo Finance
 Why Cubic Corporation’s (NYSE:CUB) Return On Capital Employed Might Be A Concern

Today we'll evaluate Cubic Corporation (NYSE:CUB) to determine whether it could have potential as an investment idea. To be precise, we'll consider its Return On Capital Employed (ROCE), as that will inform our view of the quality of the business.
First of all, we'll work out how to calculate ROCE. Then we'll compare its ROCE to similar companies. And finally, we'll look at how its current liabilities are impacting its ROCE.
What is Return On Capital Employed (ROCE)?
ROCE is a measure of a company's yearly pre-tax profit (its return), relative to the capital employed in the business. Generally speaking a higher ROCE is better. In brief, it is a useful tool, but it is not without drawbacks. Author Edwin Whiting says to be careful when comparing the ROCE of different businesses, since 'No two businesses are exactly alike.
So, How Do We Calculate ROCE?
Analysts use this formula to calculate return on capital employed:
Return on Capital Employed = Earnings Before Interest and Tax (EBIT) ÷ (Total Assets - Current Liabilities)
Or for Cubic:
0.047 = US$66m ÷ (US$1.9b - US$519m) (Based on the trailing twelve months to December 2019.)
Therefore, Cubic has an ROCE of 4.7%.
Check out our latest analysis for Cubic
Is Cubic's ROCE Good?
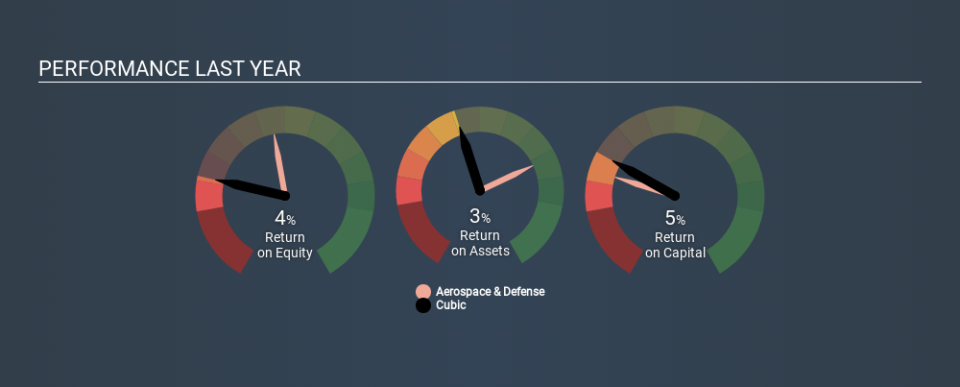
One way to assess ROCE is to compare similar companies. We can see Cubic's ROCE is meaningfully below the Aerospace & Defense industry average of 11%. This performance could be negative if sustained, as it suggests the business may underperform its industry. Putting aside Cubic's performance relative to its industry, its ROCE in absolute terms is poor - considering the risk of owning stocks compared to government bonds. It is likely that there are more attractive prospects out there.
We can see that, Cubic currently has an ROCE of 4.7% compared to its ROCE 3 years ago, which was 3.3%. This makes us wonder if the company is improving. You can click on the image below to see (in greater detail) how Cubic's past growth compares to other companies.
When considering ROCE, bear in mind that it reflects the past and does not necessarily predict the future. ROCE can be deceptive for cyclical businesses, as returns can look incredible in boom times, and terribly low in downturns. ROCE is only a point-in-time measure. Since the future is so important for investors, you should check out our free report on analyst forecasts for Cubic.
Cubic's Current Liabilities And Their Impact On Its ROCE
Current liabilities are short term bills and invoices that need to be paid in 12 months or less. Due to the way ROCE is calculated, a high level of current liabilities makes a company look as though it has less capital employed, and thus can (sometimes unfairly) boost the ROCE. To counteract this, we check if a company has high current liabilities, relative to its total assets.
Cubic has total assets of US$1.9b and current liabilities of US$519m. Therefore its current liabilities are equivalent to approximately 27% of its total assets. This is a modest level of current liabilities, which will have a limited impact on the ROCE.
Our Take On Cubic's ROCE
While that is good to see, Cubic has a low ROCE and does not look attractive in this analysis. Of course, you might find a fantastic investment by looking at a few good candidates. So take a peek at this free list of companies with modest (or no) debt, trading on a P/E below 20.
There are plenty of other companies that have insiders buying up shares. You probably do not want to miss this free list of growing companies that insiders are buying.
If you spot an error that warrants correction, please contact the editor at editorial-team@simplywallst.com. This article by Simply Wall St is general in nature. It does not constitute a recommendation to buy or sell any stock, and does not take account of your objectives, or your financial situation. Simply Wall St has no position in the stocks mentioned.
We aim to bring you long-term focused research analysis driven by fundamental data. Note that our analysis may not factor in the latest price-sensitive company announcements or qualitative material. Thank you for reading.
