
 Yahoo Finance
 Why You Should Care About IRESS Limited’s (ASX:IRE) Low Return On Capital

Today we'll evaluate IRESS Limited (ASX:IRE) to determine whether it could have potential as an investment idea. In particular, we'll consider its Return On Capital Employed (ROCE), as that can give us insight into how profitably the company is able to employ capital in its business.
First, we'll go over how we calculate ROCE. Second, we'll look at its ROCE compared to similar companies. Finally, we'll look at how its current liabilities affect its ROCE.
Understanding Return On Capital Employed (ROCE)
ROCE is a measure of a company's yearly pre-tax profit (its return), relative to the capital employed in the business. In general, businesses with a higher ROCE are usually better quality. Overall, it is a valuable metric that has its flaws. Renowned investment researcher Michael Mauboussin has suggested that a high ROCE can indicate that 'one dollar invested in the company generates value of more than one dollar'.
So, How Do We Calculate ROCE?
Analysts use this formula to calculate return on capital employed:
Return on Capital Employed = Earnings Before Interest and Tax (EBIT) ÷ (Total Assets - Current Liabilities)
Or for IRESS:
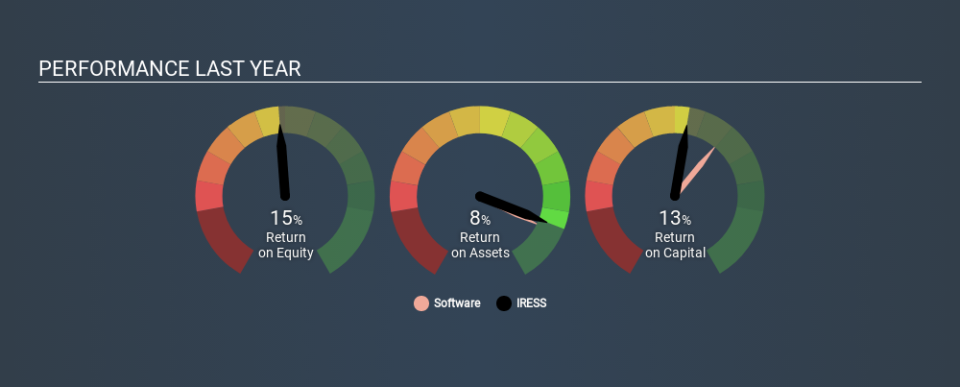
0.13 = AU$96m ÷ (AU$825m - AU$92m) (Based on the trailing twelve months to June 2019.)
Therefore, IRESS has an ROCE of 13%.
See our latest analysis for IRESS
Is IRESS's ROCE Good?
ROCE is commonly used for comparing the performance of similar businesses. We can see IRESS's ROCE is meaningfully below the Software industry average of 17%. This performance could be negative if sustained, as it suggests the business may underperform its industry. Independently of how IRESS compares to its industry, its ROCE in absolute terms appears decent, and the company may be worthy of closer investigation.
The image below shows how IRESS's ROCE compares to its industry, and you can click it to see more detail on its past growth.
When considering ROCE, bear in mind that it reflects the past and does not necessarily predict the future. ROCE can be misleading for companies in cyclical industries, with returns looking impressive during the boom times, but very weak during the busts. ROCE is only a point-in-time measure. What happens in the future is pretty important for investors, so we have prepared a free report on analyst forecasts for IRESS.
Do IRESS's Current Liabilities Skew Its ROCE?
Current liabilities are short term bills and invoices that need to be paid in 12 months or less. Due to the way ROCE is calculated, a high level of current liabilities makes a company look as though it has less capital employed, and thus can (sometimes unfairly) boost the ROCE. To check the impact of this, we calculate if a company has high current liabilities relative to its total assets.
IRESS has total liabilities of AU$92m and total assets of AU$825m. As a result, its current liabilities are equal to approximately 11% of its total assets. A fairly low level of current liabilities is not influencing the ROCE too much.
What We Can Learn From IRESS's ROCE
This is good to see, and with a sound ROCE, IRESS could be worth a closer look. IRESS looks strong on this analysis, but there are plenty of other companies that could be a good opportunity . Here is a free list of companies growing earnings rapidly.
If you like to buy stocks alongside management, then you might just love this free list of companies. (Hint: insiders have been buying them).
If you spot an error that warrants correction, please contact the editor at editorial-team@simplywallst.com. This article by Simply Wall St is general in nature. It does not constitute a recommendation to buy or sell any stock, and does not take account of your objectives, or your financial situation. Simply Wall St has no position in the stocks mentioned.
We aim to bring you long-term focused research analysis driven by fundamental data. Note that our analysis may not factor in the latest price-sensitive company announcements or qualitative material. Thank you for reading.
