
 Yahoo Finance
 Why You Should Care About Brooks Automation, Inc.’s (NASDAQ:BRKS) Low Return On Capital

Want to participate in a short research study? Help shape the future of investing tools and you could win a $250 gift card!
Today we’ll evaluate Brooks Automation, Inc. (NASDAQ:BRKS) to determine whether it could have potential as an investment idea. Specifically, we’re going to calculate its Return On Capital Employed (ROCE), in the hopes of getting some insight into the business.
First of all, we’ll work out how to calculate ROCE. Then we’ll compare its ROCE to similar companies. Finally, we’ll look at how its current liabilities affect its ROCE.
Understanding Return On Capital Employed (ROCE)
ROCE measures the ‘return’ (pre-tax profit) a company generates from capital employed in its business. Generally speaking a higher ROCE is better. Overall, it is a valuable metric that has its flaws. Author Edwin Whiting says to be careful when comparing the ROCE of different businesses, since ‘No two businesses are exactly alike.’
So, How Do We Calculate ROCE?
Analysts use this formula to calculate return on capital employed:
Return on Capital Employed = Earnings Before Interest and Tax (EBIT) ÷ (Total Assets – Current Liabilities)
Or for Brooks Automation:
0.027 = US$36m ÷ (US$1.5b – US$191m) (Based on the trailing twelve months to December 2018.)
Therefore, Brooks Automation has an ROCE of 2.7%.
View our latest analysis for Brooks Automation
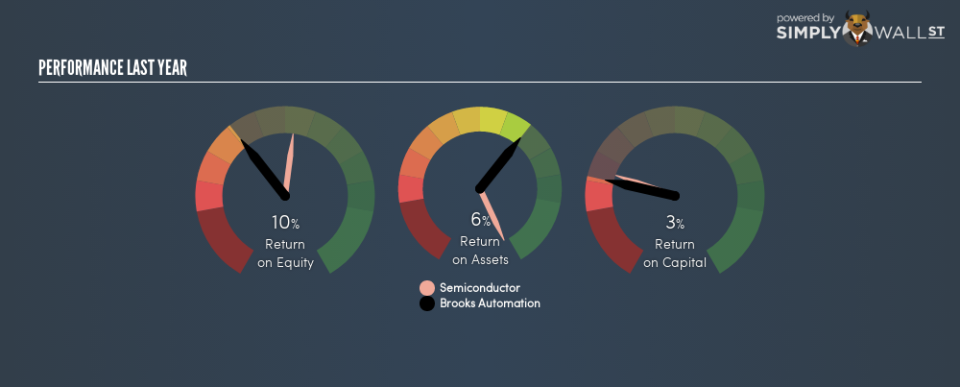
Is Brooks Automation’s ROCE Good?
ROCE is commonly used for comparing the performance of similar businesses. We can see Brooks Automation’s ROCE is meaningfully below the Semiconductor industry average of 14%. This performance could be negative if sustained, as it suggests the business may underperform its industry. Regardless of how Brooks Automation stacks up against its industry, its ROCE in absolute terms is quite low (especially compared to a bank account). Readers may wish to look for more rewarding investments.
It is important to remember that ROCE shows past performance, and is not necessarily predictive. ROCE can be deceptive for cyclical businesses, as returns can look incredible in boom times, and terribly low in downturns. ROCE is only a point-in-time measure. Since the future is so important for investors, you should check out our free report on analyst forecasts for Brooks Automation.
Brooks Automation’s Current Liabilities And Their Impact On Its ROCE
Current liabilities include invoices, such as supplier payments, short-term debt, or a tax bill, that need to be paid within 12 months. Due to the way ROCE is calculated, a high level of current liabilities makes a company look as though it has less capital employed, and thus can (sometimes unfairly) boost the ROCE. To counter this, investors can check if a company has high current liabilities relative to total assets.
Brooks Automation has total assets of US$1.5b and current liabilities of US$191m. As a result, its current liabilities are equal to approximately 13% of its total assets. This is a modest level of current liabilities, which will have a limited impact on the ROCE.
Our Take On Brooks Automation’s ROCE
That’s not a bad thing, however Brooks Automation has a weak ROCE and may not be an attractive investment. Of course, you might find a fantastic investment by looking at a few good candidates. So take a peek at this free list of companies with modest (or no) debt, trading on a P/E below 20.
For those who like to find winning investments this free list of growing companies with recent insider purchasing, could be just the ticket.
To help readers see past the short term volatility of the financial market, we aim to bring you a long-term focused research analysis purely driven by fundamental data. Note that our analysis does not factor in the latest price-sensitive company announcements.
The author is an independent contributor and at the time of publication had no position in the stocks mentioned. For errors that warrant correction please contact the editor at editorial-team@simplywallst.com.
