
 Yahoo Finance
 Why Aurizon Holdings Limited (ASX:AZJ) Delivered An Inferior ROE Compared To The Industry

The content of this article will benefit those of you who are starting to educate yourself about investing in the stock market and want to start learning about core concepts of fundamental analysis on practical examples from today’s market.
Aurizon Holdings Limited’s (ASX:AZJ) most recent return on equity was a substandard 11.8% relative to its industry performance of 12.8% over the past year. AZJ’s results could indicate a relatively inefficient operation to its peers, and while this may be the case, it is important to understand what ROE is made up of and how it should be interpreted. Knowing these components could change your view on AZJ’s performance. Metrics such as financial leverage can impact the level of ROE which in turn can affect the sustainability of AZJ’s returns. Let me show you what I mean by this.
See our latest analysis for Aurizon Holdings
What you must know about ROE
Return on Equity (ROE) weighs Aurizon Holdings’s profit against the level of its shareholders’ equity. For example, if the company invests A$1 in the form of equity, it will generate A$0.12 in earnings from this. While a higher ROE is preferred in most cases, there are several other factors we should consider before drawing any conclusions.
Return on Equity = Net Profit ÷ Shareholders Equity
ROE is measured against cost of equity in order to determine the efficiency of Aurizon Holdings’s equity capital deployed. Its cost of equity is 10.3%. Some of Aurizon Holdings’s peers may have a higher ROE but its cost of equity could exceed this return, leading to an unsustainable negative discrepancy i.e. the company spends more than it earns. This is not the case for Aurizon Holdings which is reassuring. ROE can be split up into three useful ratios: net profit margin, asset turnover, and financial leverage. This is called the Dupont Formula:
Dupont Formula
ROE = profit margin × asset turnover × financial leverage
ROE = (annual net profit ÷ sales) × (sales ÷ assets) × (assets ÷ shareholders’ equity)
ROE = annual net profit ÷ shareholders’ equity
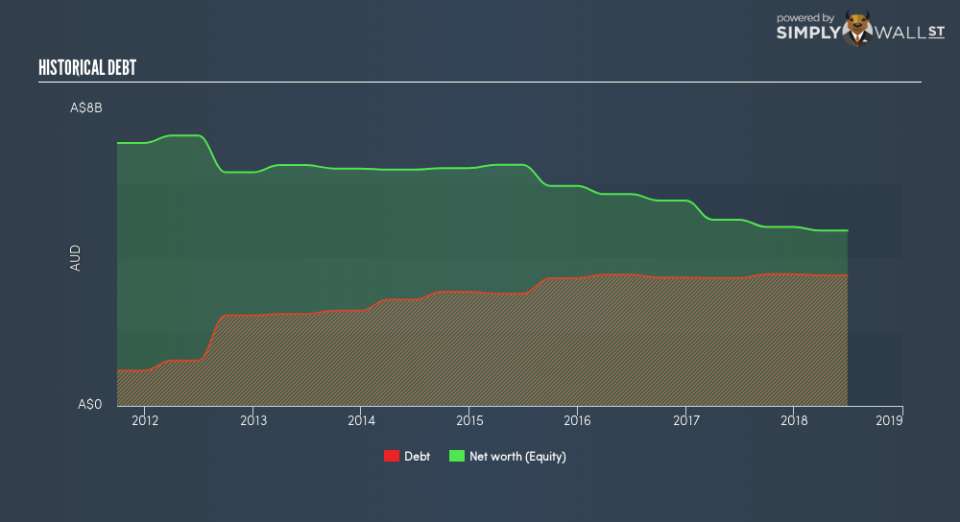
Essentially, profit margin shows how much money the company makes after paying for all its expenses. The other component, asset turnover, illustrates how much revenue Aurizon Holdings can make from its asset base. The most interesting ratio, and reflective of sustainability of its ROE, is financial leverage. Since ROE can be inflated by excessive debt, we need to examine Aurizon Holdings’s debt-to-equity level. At 74.5%, Aurizon Holdings’s debt-to-equity ratio appears sensible and indicates its ROE is generated from its capacity to increase profit without a large debt burden.
Next Steps:
While ROE is a relatively simple calculation, it can be broken down into different ratios, each telling a different story about the strengths and weaknesses of a company. Even though Aurizon Holdings returned below the industry average, its ROE comes in excess of its cost of equity. Its appropriate level of leverage means investors can be more confident in the sustainability of Aurizon Holdings’s return with a possible increase should the company decide to increase its debt levels. ROE is a helpful signal, but it is definitely not sufficient on its own to make an investment decision.
For Aurizon Holdings, I’ve put together three important aspects you should further examine:
Financial Health: Does it have a healthy balance sheet? Take a look at our free balance sheet analysis with six simple checks on key factors like leverage and risk.
Valuation: What is Aurizon Holdings worth today? Is the stock undervalued, even when its growth outlook is factored into its intrinsic value? The intrinsic value infographic in our free research report helps visualize whether Aurizon Holdings is currently mispriced by the market.
Other High-Growth Alternatives : Are there other high-growth stocks you could be holding instead of Aurizon Holdings? Explore our interactive list of stocks with large growth potential to get an idea of what else is out there you may be missing!
To help readers see past the short term volatility of the financial market, we aim to bring you a long-term focused research analysis purely driven by fundamental data. Note that our analysis does not factor in the latest price-sensitive company announcements.
The author is an independent contributor and at the time of publication had no position in the stocks mentioned. For errors that warrant correction please contact the editor at editorial-team@simplywallst.com.