
 Yahoo Finance
 Why Arch Capital Group Ltd’s (NASDAQ:ACGL) ROE Of 5.7% Does Not Tell The Whole Story

I am writing today to help inform people who are new to the stock market and want to start learning about core concepts of fundamental analysis on practical examples from today’s market.
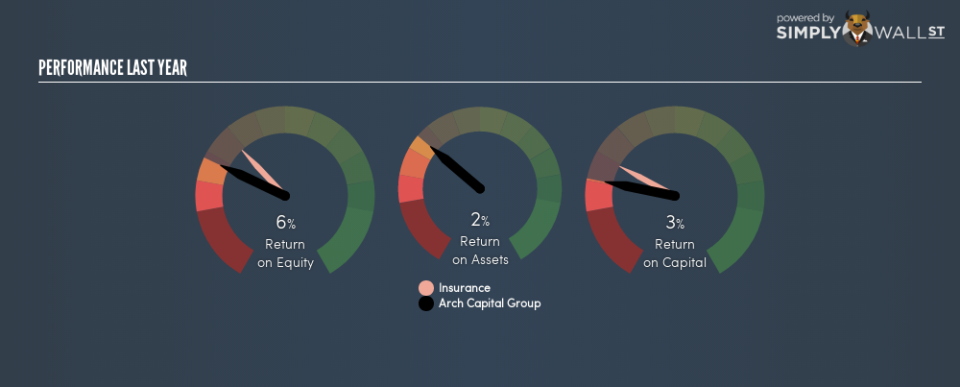
Arch Capital Group Ltd (NASDAQ:ACGL) delivered a less impressive 5.7% ROE over the past year, compared to the 9.1% return generated by its industry. An investor may attribute an inferior ROE to a relatively inefficient performance, and whilst this can often be the case, knowing the nuts and bolts of the ROE calculation may change that perspective and give you a deeper insight into ACGL’s past performance. I will take you through how metrics such as financial leverage impact ROE which may affect the overall sustainability of ACGL’s returns.
View our latest analysis for Arch Capital Group
What you must know about ROE
Return on Equity (ROE) is a measure of Arch Capital Group’s profit relative to its shareholders’ equity. It essentially shows how much the company can generate in earnings given the amount of equity it has raised. Generally speaking, a higher ROE is preferred; however, there are other factors we must also consider before making any conclusions.
Return on Equity = Net Profit ÷ Shareholders Equity
ROE is measured against cost of equity in order to determine the efficiency of Arch Capital Group’s equity capital deployed. Its cost of equity is 9.3%. This means Arch Capital Group’s returns actually do not cover its own cost of equity, with a discrepancy of -3.6%. This isn’t sustainable as it implies, very simply, that the company pays more for its capital than what it generates in return. ROE can be split up into three useful ratios: net profit margin, asset turnover, and financial leverage. This is called the Dupont Formula:
Dupont Formula
ROE = profit margin × asset turnover × financial leverage
ROE = (annual net profit ÷ sales) × (sales ÷ assets) × (assets ÷ shareholders’ equity)
ROE = annual net profit ÷ shareholders’ equity
The first component is profit margin, which measures how much of sales is retained after the company pays for all its expenses. Asset turnover reveals how much revenue can be generated from Arch Capital Group’s asset base. Finally, financial leverage will be our main focus today. It shows how much of assets are funded by equity and can show how sustainable the company’s capital structure is. Since financial leverage can artificially inflate ROE, we need to look at how much debt Arch Capital Group currently has. At 24.9%, Arch Capital Group’s debt-to-equity ratio appears low and indicates that Arch Capital Group still has room to increase leverage and grow its profits.

Next Steps:
ROE is a simple yet informative ratio, illustrating the various components that each measure the quality of the overall stock. Arch Capital Group’s below-industry ROE is disappointing, furthermore, its returns were not even high enough to cover its own cost of equity. Although, its appropriate level of leverage means investors can be more confident in the sustainability of Arch Capital Group’s return with a possible increase should the company decide to increase its debt levels. Although ROE can be a useful metric, it is only a small part of diligent research.
For Arch Capital Group, there are three essential factors you should further examine:
Financial Health: Does it have a healthy balance sheet? Take a look at our free balance sheet analysis with six simple checks on key factors like leverage and risk.
Valuation: What is Arch Capital Group worth today? Is the stock undervalued, even when its growth outlook is factored into its intrinsic value? The intrinsic value infographic in our free research report helps visualize whether Arch Capital Group is currently mispriced by the market.
Other High-Growth Alternatives : Are there other high-growth stocks you could be holding instead of Arch Capital Group? Explore our interactive list of stocks with large growth potential to get an idea of what else is out there you may be missing!
To help readers see past the short term volatility of the financial market, we aim to bring you a long-term focused research analysis purely driven by fundamental data. Note that our analysis does not factor in the latest price-sensitive company announcements.
The author is an independent contributor and at the time of publication had no position in the stocks mentioned. For errors that warrant correction please contact the editor at editorial-team@simplywallst.com.
