
 Yahoo Finance
 Why AngioDynamics, Inc.’s (NASDAQ:ANGO) Return On Capital Employed Might Be A Concern

Today we'll evaluate AngioDynamics, Inc. (NASDAQ:ANGO) to determine whether it could have potential as an investment idea. Specifically, we'll consider its Return On Capital Employed (ROCE), since that will give us an insight into how efficiently the business can generate profits from the capital it requires.
First, we'll go over how we calculate ROCE. Next, we'll compare it to others in its industry. Finally, we'll look at how its current liabilities affect its ROCE.
What is Return On Capital Employed (ROCE)?
ROCE measures the 'return' (pre-tax profit) a company generates from capital employed in its business. All else being equal, a better business will have a higher ROCE. Overall, it is a valuable metric that has its flaws. Renowned investment researcher Michael Mauboussin has suggested that a high ROCE can indicate that 'one dollar invested in the company generates value of more than one dollar'.
So, How Do We Calculate ROCE?
The formula for calculating the return on capital employed is:
Return on Capital Employed = Earnings Before Interest and Tax (EBIT) ÷ (Total Assets - Current Liabilities)
Or for AngioDynamics:
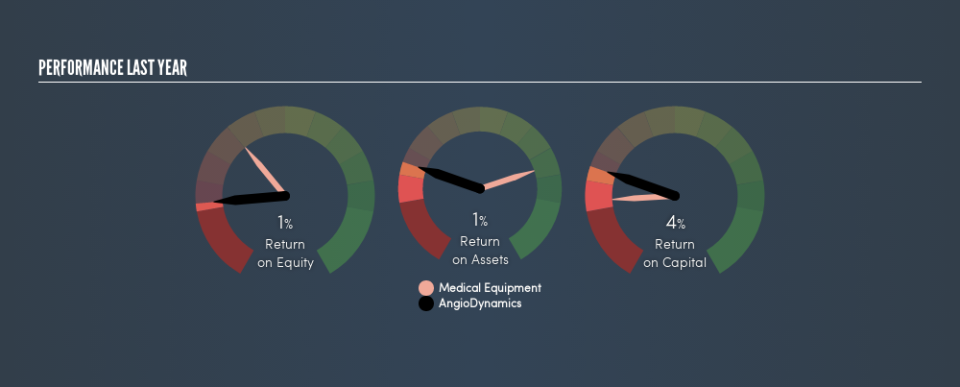
0.035 = US$26m ÷ (US$778m - US$53m) (Based on the trailing twelve months to February 2019.)
So, AngioDynamics has an ROCE of 3.5%.
Check out our latest analysis for AngioDynamics
Does AngioDynamics Have A Good ROCE?
One way to assess ROCE is to compare similar companies. Using our data, AngioDynamics's ROCE appears to be significantly below the 11% average in the Medical Equipment industry. This performance is not ideal, as it suggests the company may not be deploying its capital as effectively as some competitors. Putting aside AngioDynamics's performance relative to its industry, its ROCE in absolute terms is poor - considering the risk of owning stocks compared to government bonds. Readers may wish to look for more rewarding investments.
Our data shows that AngioDynamics currently has an ROCE of 3.5%, compared to its ROCE of 0.8% 3 years ago. This makes us think the business might be improving.
Remember that this metric is backwards looking - it shows what has happened in the past, and does not accurately predict the future. ROCE can be deceptive for cyclical businesses, as returns can look incredible in boom times, and terribly low in downturns. ROCE is, after all, simply a snap shot of a single year. Since the future is so important for investors, you should check out our free report on analyst forecasts for AngioDynamics.
Do AngioDynamics's Current Liabilities Skew Its ROCE?
Short term (or current) liabilities, are things like supplier invoices, overdrafts, or tax bills that need to be paid within 12 months. Due to the way the ROCE equation works, having large bills due in the near term can make it look as though a company has less capital employed, and thus a higher ROCE than usual. To counter this, investors can check if a company has high current liabilities relative to total assets.
AngioDynamics has total assets of US$778m and current liabilities of US$53m. As a result, its current liabilities are equal to approximately 6.9% of its total assets. AngioDynamics has a low level of current liabilities, which have a negligible impact on its already low ROCE.
What We Can Learn From AngioDynamics's ROCE
Still, investors could probably find more attractive prospects with better performance out there. Of course, you might find a fantastic investment by looking at a few good candidates. So take a peek at this free list of companies with modest (or no) debt, trading on a P/E below 20.
If you are like me, then you will not want to miss this free list of growing companies that insiders are buying.
We aim to bring you long-term focused research analysis driven by fundamental data. Note that our analysis may not factor in the latest price-sensitive company announcements or qualitative material.
If you spot an error that warrants correction, please contact the editor at editorial-team@simplywallst.com. This article by Simply Wall St is general in nature. It does not constitute a recommendation to buy or sell any stock, and does not take account of your objectives, or your financial situation. Simply Wall St has no position in the stocks mentioned. Thank you for reading.
