
 Yahoo Finance
 Why ALS Limited (ASX:ALQ) Delivered An Inferior ROE Compared To The Industry

ALS Limited (ASX:ALQ) delivered a less impressive 6.01% ROE over the past year, compared to the 12.33% return generated by its industry. An investor may attribute an inferior ROE to a relatively inefficient performance, and whilst this can often be the case, knowing the nuts and bolts of the ROE calculation may change that perspective and give you a deeper insight into ALQ’s past performance. I will take you through how metrics such as financial leverage impact ROE which may affect the overall sustainability of ALQ’s returns. View our latest analysis for ALS
Breaking down ROE — the mother of all ratios
Return on Equity (ROE) is a measure of ALS’s profit relative to its shareholders’ equity. It essentially shows how much the company can generate in earnings given the amount of equity it has raised. In most cases, a higher ROE is preferred; however, there are many other factors we must consider prior to making any investment decisions.
Return on Equity = Net Profit ÷ Shareholders Equity
Returns are usually compared to costs to measure the efficiency of capital. ALS’s cost of equity is 10.08%. Since ALS’s return does not cover its cost, with a difference of -4.07%, this means its current use of equity is not efficient and not sustainable. Very simply, ALS pays more for its capital than what it generates in return. ROE can be split up into three useful ratios: net profit margin, asset turnover, and financial leverage. This is called the Dupont Formula:
Dupont Formula
ROE = profit margin × asset turnover × financial leverage
ROE = (annual net profit ÷ sales) × (sales ÷ assets) × (assets ÷ shareholders’ equity)
ROE = annual net profit ÷ shareholders’ equity
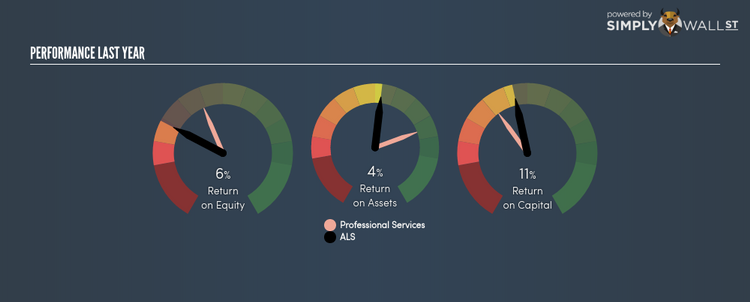
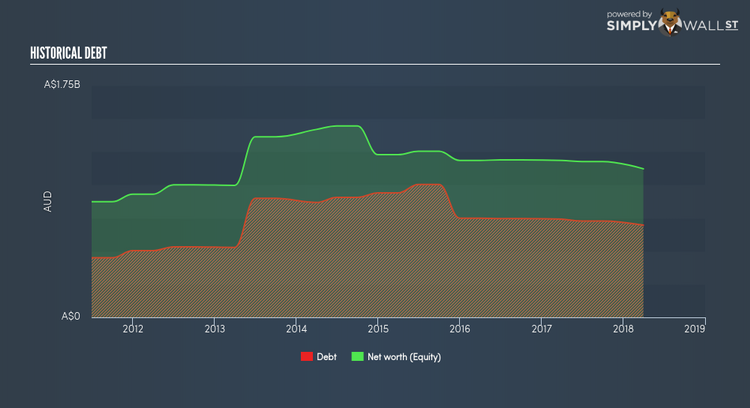
The first component is profit margin, which measures how much of sales is retained after the company pays for all its expenses. Asset turnover shows how much revenue ALS can generate with its current asset base. The most interesting ratio, and reflective of sustainability of its ROE, is financial leverage. Since ROE can be inflated by excessive debt, we need to examine ALS’s debt-to-equity level. At 62.03%, ALS’s debt-to-equity ratio appears sensible and indicates its ROE is generated from its capacity to increase profit without a large debt burden.
Next Steps:
ROE is one of many ratios which meaningfully dissects financial statements, which illustrates the quality of a company. ALS’s below-industry ROE is disappointing, furthermore, its returns were not even high enough to cover its own cost of equity. Although, its appropriate level of leverage means investors can be more confident in the sustainability of ALS’s return with a possible increase should the company decide to increase its debt levels. Although ROE can be a useful metric, it is only a small part of diligent research.
For ALS, I’ve put together three essential factors you should further research:
Financial Health: Does it have a healthy balance sheet? Take a look at our free balance sheet analysis with six simple checks on key factors like leverage and risk.
Valuation: What is ALS worth today? Is the stock undervalued, even when its growth outlook is factored into its intrinsic value? The intrinsic value infographic in our free research report helps visualize whether ALS is currently mispriced by the market.
Other High-Growth Alternatives : Are there other high-growth stocks you could be holding instead of ALS? Explore our interactive list of stocks with large growth potential to get an idea of what else is out there you may be missing!
To help readers see pass the short term volatility of the financial market, we aim to bring you a long-term focused research analysis purely driven by fundamental data. Note that our analysis does not factor in the latest price sensitive company announcements.
The author is an independent contributor and at the time of publication had no position in the stocks mentioned.
