
 Yahoo Finance
 While shareholders of Qantas Airways (ASX:QAN) are in the black over 5 years, those who bought a week ago aren't so fortunate
Qantas Airways Limited (ASX:QAN) shareholders have seen the share price descend 13% over the month. But at least the stock is up over the last five years. In that time, it is up 45%, which isn't bad, but is below the market return of 62%.
While this past week has detracted from the company's five-year return, let's look at the recent trends of the underlying business and see if the gains have been in alignment.
Check out our latest analysis for Qantas Airways
Qantas Airways wasn't profitable in the last twelve months, it is unlikely we'll see a strong correlation between its share price and its earnings per share (EPS). Arguably revenue is our next best option. Generally speaking, companies without profits are expected to grow revenue every year, and at a good clip. That's because fast revenue growth can be easily extrapolated to forecast profits, often of considerable size.
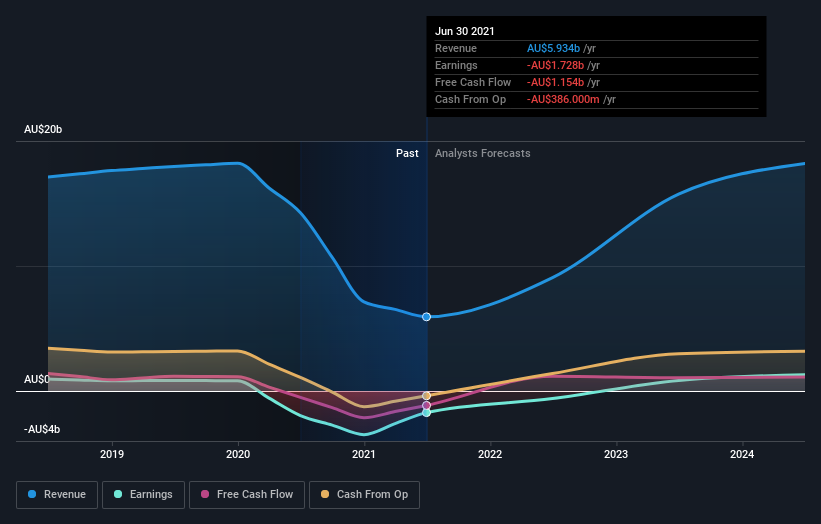
In the last 5 years Qantas Airways saw its revenue shrink by 10% per year. Even though revenue hasn't increased, the stock actually gained 8%, per year, during the same period. To us that suggests that there probably isn't a lot of correlation between the past revenue performance and the share price, but a closer look at analyst forecasts and the bottom line may well explain a lot.
You can see how earnings and revenue have changed over time in the image below (click on the chart to see the exact values).
Qantas Airways is well known by investors, and plenty of clever analysts have tried to predict the future profit levels. So we recommend checking out this free report showing consensus forecasts
What about the Total Shareholder Return (TSR)?
We've already covered Qantas Airways' share price action, but we should also mention its total shareholder return (TSR). The TSR is a return calculation that accounts for the value of cash dividends (assuming that any dividend received was reinvested) and the calculated value of any discounted capital raisings and spin-offs. Dividends have been really beneficial for Qantas Airways shareholders, and that cash payout contributed to why its TSR of 61%, over the last 5 years, is better than the share price return.
A Different Perspective
While the broader market gained around 17% in the last year, Qantas Airways shareholders lost 3.7%. However, keep in mind that even the best stocks will sometimes underperform the market over a twelve month period. On the bright side, long term shareholders have made money, with a gain of 10% per year over half a decade. If the fundamental data continues to indicate long term sustainable growth, the current sell-off could be an opportunity worth considering. It's always interesting to track share price performance over the longer term. But to understand Qantas Airways better, we need to consider many other factors. To that end, you should be aware of the 1 warning sign we've spotted with Qantas Airways .
If you would prefer to check out another company -- one with potentially superior financials -- then do not miss this free list of companies that have proven they can grow earnings.
Please note, the market returns quoted in this article reflect the market weighted average returns of stocks that currently trade on AU exchanges.
Have feedback on this article? Concerned about the content? Get in touch with us directly. Alternatively, email editorial-team (at) simplywallst.com.
This article by Simply Wall St is general in nature. We provide commentary based on historical data and analyst forecasts only using an unbiased methodology and our articles are not intended to be financial advice. It does not constitute a recommendation to buy or sell any stock, and does not take account of your objectives, or your financial situation. We aim to bring you long-term focused analysis driven by fundamental data. Note that our analysis may not factor in the latest price-sensitive company announcements or qualitative material. Simply Wall St has no position in any stocks mentioned.
