
 Yahoo Finance
 Where Westpac Banking Corporation (ASX:WBC) Stands In Terms Of Earnings Growth Against Its Industry

Measuring Westpac Banking Corporation’s (ASX:WBC) track record of past performance is a useful exercise for investors. It enables us to understand whether or not the company has met or exceed expectations, which is an insightful signal for future performance. Today I will assess WBC’s recent performance announced on 31 March 2018 and weigh these figures against its long-term trend and industry movements. See our latest analysis for Westpac Banking
Did WBC beat its long-term earnings growth trend and its industry?
I look at data from the most recent 12 months, which annualizes the latest 6-month earnings release, or some times, the latest annual report is already the most recent financial data. This blend enables me to analyze many different companies on a more comparable basis, using the latest information. For Westpac Banking, its most recent bottom-line (trailing twelve month) is AU$8.27B, which, relative to last year’s level, has increased by a fairly unexciting 8.20%. Given that these values are somewhat myopic, I’ve determined an annualized five-year value for Westpac Banking’s earnings, which stands at AU$7.24B This suggests that, generally, Westpac Banking has been able to steadily improve its bottom line over the past few years as well.
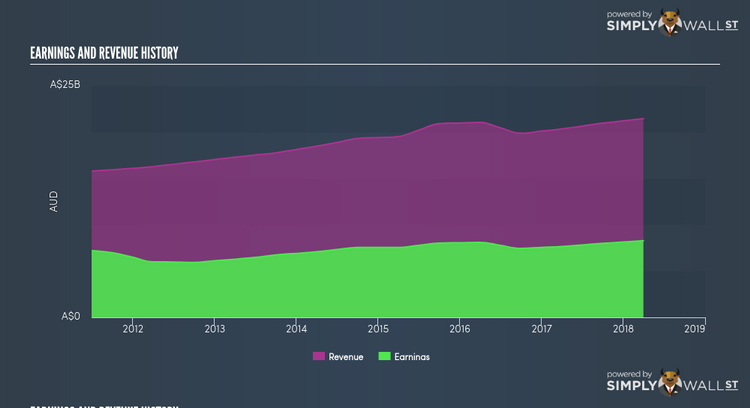
What’s enabled this growth? Well, let’s take a look at if it is merely because of industry tailwinds, or if Westpac Banking has experienced some company-specific growth. The climb in earnings seems to be bolstered by a robust top-line increase beating its growth rate of expenses. Though this has led to a margin contraction, it has made Westpac Banking more profitable. Scanning growth from a sector-level, the Australian banks industry has been growing, albeit, at a muted single-digit rate of 8.48% in the previous twelve months, and 6.64% over the last five years. This suggests that any tailwind the industry is profiting from, Westpac Banking has not been able to reap as much as its average peer.
What does this mean?
Though Westpac Banking’s past data is helpful, it is only one aspect of my investment thesis. Positive growth and profitability are what investors like to see in a company’s track record, but how do we properly assess sustainability? You should continue to research Westpac Banking to get a better picture of the stock by looking at:
Future Outlook: What are well-informed industry analysts predicting for WBC’s future growth? Take a look at our free research report of analyst consensus for WBC’s outlook.
Financial Health: Is WBC’s operations financially sustainable? Balance sheets can be hard to analyze, which is why we’ve done it for you. Check out our financial health checks here.
Other High-Performing Stocks: Are there other stocks that provide better prospects with proven track records? Explore our free list of these great stocks here.
NB: Figures in this article are calculated using data from the trailing twelve months from 31 March 2018. This may not be consistent with full year annual report figures.
To help readers see pass the short term volatility of the financial market, we aim to bring you a long-term focused research analysis purely driven by fundamental data. Note that our analysis does not factor in the latest price sensitive company announcements.
The author is an independent contributor and at the time of publication had no position in the stocks mentioned.
