
 Yahoo Finance
 Where General Dynamics Corporation (NYSE:GD) Stands In Terms Of Earnings Growth Against Its Industry

Examining General Dynamics Corporation's (NYSE:GD) past track record of performance is an insightful exercise for investors. It allows us to reflect on whether or not the company has met or exceed expectations, which is a great indicator for future performance. Today I will assess GD's latest performance announced on 30 June 2019 and compare these figures to its longer term trend and industry movements.
Check out our latest analysis for General Dynamics
Commentary On GD's Past Performance
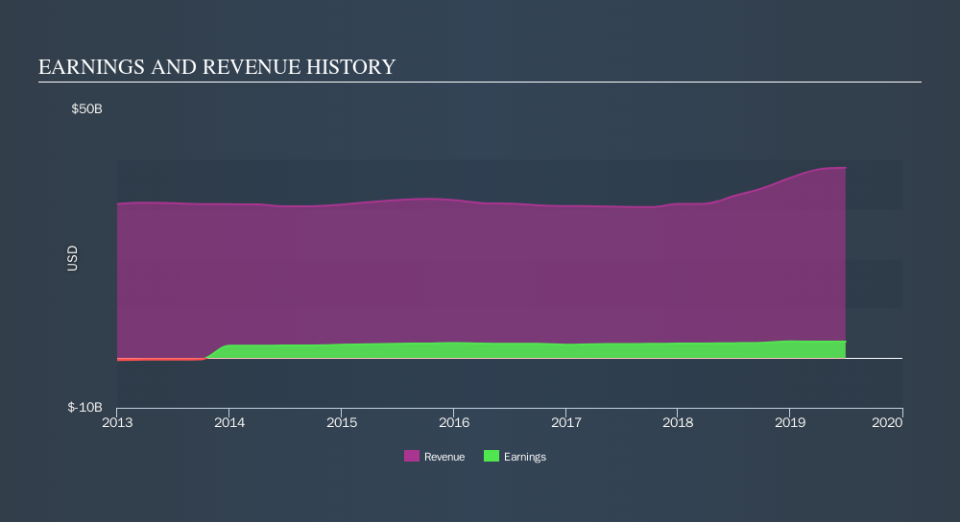
GD's trailing twelve-month earnings (from 30 June 2019) of US$3.3b has jumped 11% compared to the previous year.
Furthermore, this one-year growth rate has exceeded its 5-year annual growth average of 3.9%, indicating the rate at which GD is growing has accelerated. What's enabled this growth? Let's see whether it is solely due to industry tailwinds, or if General Dynamics has seen some company-specific growth.
In terms of returns from investment, General Dynamics has invested its equity funds well leading to a 26% return on equity (ROE), above the sensible minimum of 20%. Furthermore, its return on assets (ROA) of 7.9% exceeds the US Aerospace & Defense industry of 6.6%, indicating General Dynamics has used its assets more efficiently. However, its return on capital (ROC), which also accounts for General Dynamics’s debt level, has declined over the past 3 years from 21% to 15%. This correlates with an increase in debt holding, with debt-to-equity ratio rising from 30% to 108% over the past 5 years.
What does this mean?
General Dynamics's track record can be a valuable insight into its earnings performance, but it certainly doesn't tell the whole story. While General Dynamics has a good historical track record with positive growth and profitability, there's no certainty that this will extrapolate into the future. I suggest you continue to research General Dynamics to get a more holistic view of the stock by looking at:
Future Outlook: What are well-informed industry analysts predicting for GD’s future growth? Take a look at our free research report of analyst consensus for GD’s outlook.
Financial Health: Are GD’s operations financially sustainable? Balance sheets can be hard to analyze, which is why we’ve done it for you. Check out our financial health checks here.
Other High-Performing Stocks: Are there other stocks that provide better prospects with proven track records? Explore our free list of these great stocks here.
NB: Figures in this article are calculated using data from the trailing twelve months from 30 June 2019. This may not be consistent with full year annual report figures.
We aim to bring you long-term focused research analysis driven by fundamental data. Note that our analysis may not factor in the latest price-sensitive company announcements or qualitative material.
If you spot an error that warrants correction, please contact the editor at editorial-team@simplywallst.com. This article by Simply Wall St is general in nature. It does not constitute a recommendation to buy or sell any stock, and does not take account of your objectives, or your financial situation. Simply Wall St has no position in the stocks mentioned. Thank you for reading.
