
 Yahoo Finance
 Where CompX International Inc (NYSEMKT:CIX) Stands In Terms Of Earnings Growth Against Its Industry

For long-term investors, assessing earnings trend over time and against industry benchmarks is more beneficial than examining a single earnings announcement at a point in time. Investors may find my commentary, albeit very high-level and brief, on CompX International Inc (AMEX:CIX) useful as an attempt to give more color around how CompX International is currently performing. See our latest analysis for CompX International
Could CIX beat the long-term trend and outperform its industry?
For the purpose of this commentary, I like to use data from the most recent 12 months, which either annualizes the most recent 6-month earnings update, or in some cases, the most recent annual report is already the latest available financial data. This blend allows me to examine many different companies on a more comparable basis, using the latest information. For CompX International, its most recent trailing-twelve-month earnings is US$13.78M, which compared to the prior year’s figure, has risen by 20.78%. Since these values are fairly nearsighted, I have estimated an annualized five-year figure for CompX International’s net income, which stands at US$7.49M This means generally, CompX International has been able to increasingly improve its bottom line over the past few years as well.
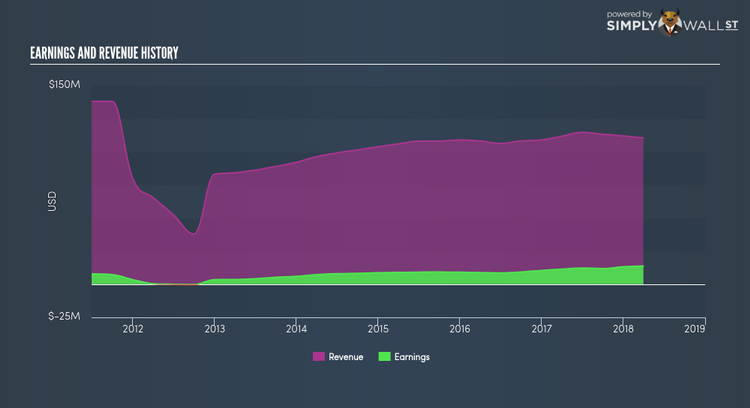
How has it been able to do this? Well, let’s take a look at whether it is merely because of an industry uplift, or if CompX International has experienced some company-specific growth. Over the last few years, CompX International grew its bottom line faster than revenue by successfully controlling its costs. This has caused a margin expansion and profitability over time. Inspecting growth from a sector-level, the US commercial services industry has been growing, albeit, at a unexciting single-digit rate of 5.63% over the past twelve months, and a substantial 11.14% over the previous five years. This means that whatever tailwind the industry is profiting from, CompX International is able to amplify this to its advantage.
What does this mean?
Though CompX International’s past data is helpful, it is only one aspect of my investment thesis. Positive growth and profitability are what investors like to see in a company’s track record, but how do we properly assess sustainability? I suggest you continue to research CompX International to get a more holistic view of the stock by looking at:
Future Outlook: What are well-informed industry analysts predicting for CIX’s future growth? Take a look at our free research report of analyst consensus for CIX’s outlook.
Financial Health: Is CIX’s operations financially sustainable? Balance sheets can be hard to analyze, which is why we’ve done it for you. Check out our financial health checks here.
Other High-Performing Stocks: Are there other stocks that provide better prospects with proven track records? Explore our free list of these great stocks here.
NB: Figures in this article are calculated using data from the trailing twelve months from 31 March 2018. This may not be consistent with full year annual report figures.
To help readers see pass the short term volatility of the financial market, we aim to bring you a long-term focused research analysis purely driven by fundamental data. Note that our analysis does not factor in the latest price sensitive company announcements.
The author is an independent contributor and at the time of publication had no position in the stocks mentioned.
