
 Yahoo Finance
 WestStar Industrial (ASX:WSI) Will Be Hoping To Turn Its Returns On Capital Around
If you're not sure where to start when looking for the next multi-bagger, there are a few key trends you should keep an eye out for. Amongst other things, we'll want to see two things; firstly, a growing return on capital employed (ROCE) and secondly, an expansion in the company's amount of capital employed. This shows us that it's a compounding machine, able to continually reinvest its earnings back into the business and generate higher returns. Having said that, from a first glance at WestStar Industrial (ASX:WSI) we aren't jumping out of our chairs at how returns are trending, but let's have a deeper look.
What is Return On Capital Employed (ROCE)?
If you haven't worked with ROCE before, it measures the 'return' (pre-tax profit) a company generates from capital employed in its business. To calculate this metric for WestStar Industrial, this is the formula:
Return on Capital Employed = Earnings Before Interest and Tax (EBIT) ÷ (Total Assets - Current Liabilities)
0.15 = AU$2.3m ÷ (AU$32m - AU$17m) (Based on the trailing twelve months to December 2020).
Thus, WestStar Industrial has an ROCE of 15%. In absolute terms, that's a satisfactory return, but compared to the Metals and Mining industry average of 9.5% it's much better.
See our latest analysis for WestStar Industrial
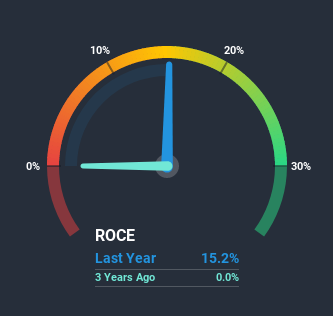
Historical performance is a great place to start when researching a stock so above you can see the gauge for WestStar Industrial's ROCE against it's prior returns. If you'd like to look at how WestStar Industrial has performed in the past in other metrics, you can view this free graph of past earnings, revenue and cash flow.
The Trend Of ROCE
In terms of WestStar Industrial's historical ROCE movements, the trend isn't fantastic. To be more specific, ROCE has fallen from 47% over the last one year. Meanwhile, the business is utilizing more capital but this hasn't moved the needle much in terms of sales in the past 12 months, so this could reflect longer term investments. It's worth keeping an eye on the company's earnings from here on to see if these investments do end up contributing to the bottom line.
On a side note, WestStar Industrial has done well to pay down its current liabilities to 53% of total assets. So we could link some of this to the decrease in ROCE. What's more, this can reduce some aspects of risk to the business because now the company's suppliers or short-term creditors are funding less of its operations. Some would claim this reduces the business' efficiency at generating ROCE since it is now funding more of the operations with its own money. Either way, they're still at a pretty high level, so we'd like to see them fall further if possible.
The Bottom Line
Bringing it all together, while we're somewhat encouraged by WestStar Industrial's reinvestment in its own business, we're aware that returns are shrinking. Since the stock has declined 16% over the last three years, investors may not be too optimistic on this trend improving either. Therefore based on the analysis done in this article, we don't think WestStar Industrial has the makings of a multi-bagger.
One more thing to note, we've identified 3 warning signs with WestStar Industrial and understanding these should be part of your investment process.
While WestStar Industrial may not currently earn the highest returns, we've compiled a list of companies that currently earn more than 25% return on equity. Check out this free list here.
This article by Simply Wall St is general in nature. It does not constitute a recommendation to buy or sell any stock, and does not take account of your objectives, or your financial situation. We aim to bring you long-term focused analysis driven by fundamental data. Note that our analysis may not factor in the latest price-sensitive company announcements or qualitative material. Simply Wall St has no position in any stocks mentioned.
Have feedback on this article? Concerned about the content? Get in touch with us directly. Alternatively, email editorial-team (at) simplywallst.com.
