
 Yahoo Finance
 Western Digital (WDC) Q3 Earnings Beat, Revenues Fall Y/Y
Western Digital Corporation WDC reported third-quarter fiscal 2023 non-GAAP loss of $1.37 per share, narrower than the Zacks Consensus Estimate of a loss of $1.55. The company had reported earnings of $1.65 in the prior-year quarter.
The performance was affected by challenging macro environment and underutilization charges which weighed on the margins.
Revenues of $2.803 billion beat the Zacks Consensus Estimate by 1.4%. However, the top line decreased 36% year over year owing to weak performance across all segments. On a sequential basis, revenues declined 10%.
Western Digital Corporation Price, Consensus and EPS Surprise

Western Digital Corporation price-consensus-eps-surprise-chart | Western Digital Corporation Quote
In the past year, shares of Western Digital have lost 40.4% of their value compared with the sub-industry’s decline of 14.7%.
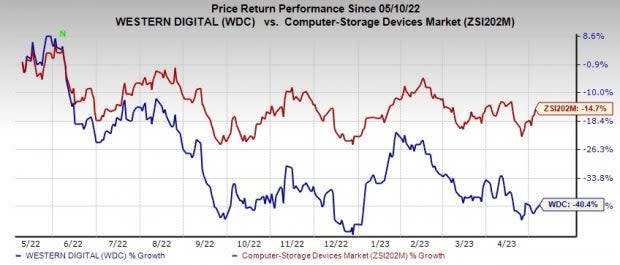
Image Source: Zacks Investment Research
Quarter in Detail
Beginning first-quarter fiscal 2022, Western Digital started reporting revenues under three refined end markets — Cloud (includes products for public or private cloud), Client (includes products sold directly to OEMs or through distribution) and Consumer (includes retail and other end-user products).
Revenues from the Cloud end market (43% of total revenues) fell 32% year over year to $1.205 billion owing to lower flash pricing, and lower shipments of both hard drive and flash products. On a sequential basis, cloud revenues were down 2%.
Revenues from the Client end market (35% of total revenues) were down 44% year over year to $975 billion. The downtick was caused by lower flash pricing on a year-over-year basis, coupled with reduced client SSD and hard drive shipments for PC applications. Client revenues declined 10% sequentially.
Revenues from the Consumer end market (22% of total revenues) were down 29% year over year to $623 million. Revenues decreased 22% on a sequential basis. Sequential performance was hurt by seasonal decline in demand for both retail hard drives and flash products.
Considering revenues by product group, Flash revenues (46.6% of total revenues) declined 42% from the year-ago quarter’s figure to $1.307 billion. Sequentially, flash revenues fell 21%.
HDD revenues (53.4% of total revenues) decreased 30% year over year to $1.496 billion. Revenues were up 3% quarter over quarter.
Key Metrics
The company shipped 12.6 million HDDs at an average selling price (ASP) of $109. The reported shipments declined 36.4% from the prior-year quarter’s levels.
On a quarter-over-quarter basis, HDD Exabytes sales were up 15%. Flash exabytes sales were down 14%. Total exabytes sales (excluding non-memory products) were up 9% sequentially.
ASP/Gigabytes (excluding licensing, royalties, and non-memory products) were down 10% sequentially.
Margins
Non-GAAP gross margin was 10.6% compared with 31.7% reported in the year-ago quarter. The gross margin performance was mainly impacted by $275 million of charges incurred for manufacturing underutilization and inventory write downs among other expenses.
HDD gross margin contracted 340 bps year over year to 24.3%. Flash gross margin was a negative 5% against 36% reported in the prior-year quarter.
Non-GAAP operating expenses moved down 19% from the year-ago quarter’s level to $602 million.
Non-GAAP operating loss totaled $304 million against the non-GAAP operating income of $650 million in the prior-year quarter.
Balance Sheet & Cash Flow
As of Mar 31, cash and cash equivalents were $2.22 billion compared with $1.871 billion reported as of Dec 30, 2022.
The long-term debt (including current portion) was $7.073 billion as of Mar 31.
Western Digital used $381 million in cash from operations against $398 million of cash generated from operations in the previous-year quarter.
Free cash outflow amounted to $527 million against the free cash flow $148 million reported in the prior-year quarter.
Q4 Guidance
For fourth-quarter fiscal 2023, the company expects non-GAAP revenues in the range of $2.4-$2.6 billion. The Zacks Consensus Estimate is currently pegged at $2.9 billion.
Management projects non-GAAP loss per share to be between $1.90 and $2.20. The Zacks Consensus Estimate is currently pegged at a loss of $1.31.
WDC expects non-GAAP gross margin in the range of 3-5%. Non-GAAP operating expenses are expected to be between $580 million and $600 million.
Zacks Rank & Stocks to Consider
Currently, Western Digital carries a Zacks Rank #3 (Hold).
Some better-ranked stocks in the broader technology space are Badger Meter BMI, ANSYS ANSS and Blackbaud BLKB. BMI currently sports a Zacks Rank #1 (Strong Buy) whereas ANSYS and Blackbaud carry a Zacks Rank #2 (Buy). You can see the complete list of today’s Zacks #1 Rank stocks here.
The Zacks Consensus Estimate for Badger Meter’s 2023 earnings has increased 4.7% in the past 60 days to $2.69 per share. BMI’s earnings beat the Zacks Consensus Estimate in the last four quarters, the average being 5.3%. Shares of BMI have surged 77.5% in the past year.
The Zacks Consensus Estimate for ANSYS’ 2023 earnings has been unchanged in the past 30 days to $8.56 per share. The long-term earnings growth rate is expected to be 7.6%.
ANSS earnings beat the Zacks Consensus Estimate in the last four quarters, the average surprise being 11.6%. Shares of ANSS have gained 17.4% in the past year.
The Zacks Consensus Estimate for Blackbaud’s 2023 earnings is pegged at $3.53 per share, up 2.9% in the past 60 days. The long-term earnings growth rate is anticipated to be 10.4%.
Blackbaud’s earnings beat the Zacks Consensus Estimate in the last four quarters, the average being 10.4%. Shares of BLKB have increased 42.4% in the past year.
Want the latest recommendations from Zacks Investment Research? Today, you can download 7 Best Stocks for the Next 30 Days. Click to get this free report
Badger Meter, Inc. (BMI) : Free Stock Analysis Report
Western Digital Corporation (WDC) : Free Stock Analysis Report
Blackbaud, Inc. (BLKB) : Free Stock Analysis Report
ANSYS, Inc. (ANSS) : Free Stock Analysis Report
