
 Yahoo Finance
 We're Not Very Worried About Provaris Energy's (ASX:PV1) Cash Burn Rate
Even when a business is losing money, it's possible for shareholders to make money if they buy a good business at the right price. For example, biotech and mining exploration companies often lose money for years before finding success with a new treatment or mineral discovery. Nonetheless, only a fool would ignore the risk that a loss making company burns through its cash too quickly.
So should Provaris Energy (ASX:PV1) shareholders be worried about its cash burn? In this report, we will consider the company's annual negative free cash flow, henceforth referring to it as the 'cash burn'. The first step is to compare its cash burn with its cash reserves, to give us its 'cash runway'.
See our latest analysis for Provaris Energy
How Long Is Provaris Energy's Cash Runway?
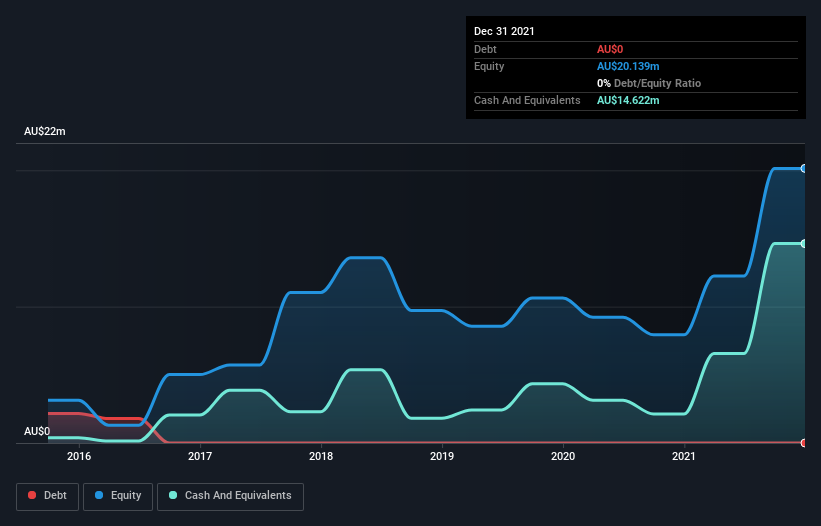
A company's cash runway is calculated by dividing its cash hoard by its cash burn. In December 2021, Provaris Energy had AU$15m in cash, and was debt-free. Importantly, its cash burn was AU$3.4m over the trailing twelve months. That means it had a cash runway of about 4.3 years as of December 2021. There's no doubt that this is a reassuringly long runway. Depicted below, you can see how its cash holdings have changed over time.
How Is Provaris Energy's Cash Burn Changing Over Time?
Provaris Energy didn't record any revenue over the last year, indicating that it's an early stage company still developing its business. So while we can't look to sales to understand growth, we can look at how the cash burn is changing to understand how expenditure is trending over time. With the cash burn rate up 39% in the last year, it seems that the company is ratcheting up investment in the business over time. However, the company's true cash runway will therefore be shorter than suggested above, if spending continues to increase. While the past is always worth studying, it is the future that matters most of all. For that reason, it makes a lot of sense to take a look at our analyst forecasts for the company.
How Easily Can Provaris Energy Raise Cash?
Given its cash burn trajectory, Provaris Energy shareholders may wish to consider how easily it could raise more cash, despite its solid cash runway. Companies can raise capital through either debt or equity. Commonly, a business will sell new shares in itself to raise cash and drive growth. We can compare a company's cash burn to its market capitalisation to get a sense for how many new shares a company would have to issue to fund one year's operations.
Since it has a market capitalisation of AU$31m, Provaris Energy's AU$3.4m in cash burn equates to about 11% of its market value. As a result, we'd venture that the company could raise more cash for growth without much trouble, albeit at the cost of some dilution.
Is Provaris Energy's Cash Burn A Worry?
It may already be apparent to you that we're relatively comfortable with the way Provaris Energy is burning through its cash. For example, we think its cash runway suggests that the company is on a good path. Although its increasing cash burn does give us reason for pause, the other metrics we discussed in this article form a positive picture overall. After taking into account the various metrics mentioned in this report, we're pretty comfortable with how the company is spending its cash, as it seems on track to meet its needs over the medium term. On another note, we conducted an in-depth investigation of the company, and identified 6 warning signs for Provaris Energy (2 are concerning!) that you should be aware of before investing here.
Of course Provaris Energy may not be the best stock to buy. So you may wish to see this free collection of companies boasting high return on equity, or this list of stocks that insiders are buying.
Have feedback on this article? Concerned about the content? Get in touch with us directly. Alternatively, email editorial-team (at) simplywallst.com.
This article by Simply Wall St is general in nature. We provide commentary based on historical data and analyst forecasts only using an unbiased methodology and our articles are not intended to be financial advice. It does not constitute a recommendation to buy or sell any stock, and does not take account of your objectives, or your financial situation. We aim to bring you long-term focused analysis driven by fundamental data. Note that our analysis may not factor in the latest price-sensitive company announcements or qualitative material. Simply Wall St has no position in any stocks mentioned.
