
 Yahoo Finance
 We're Keeping An Eye On TNG's (ASX:TNG) Cash Burn Rate
Even when a business is losing money, it's possible for shareholders to make money if they buy a good business at the right price. For example, although Amazon.com made losses for many years after listing, if you had bought and held the shares since 1999, you would have made a fortune. But the harsh reality is that very many loss making companies burn through all their cash and go bankrupt.
Given this risk, we thought we'd take a look at whether TNG (ASX:TNG) shareholders should be worried about its cash burn. For the purposes of this article, cash burn is the annual rate at which an unprofitable company spends cash to fund its growth; its negative free cash flow. The first step is to compare its cash burn with its cash reserves, to give us its 'cash runway'.
See our latest analysis for TNG
When Might TNG Run Out Of Money?
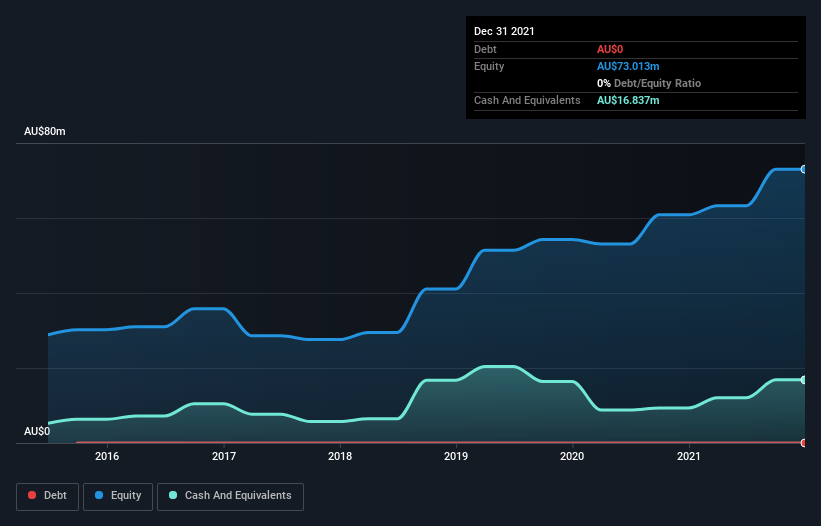
A company's cash runway is calculated by dividing its cash hoard by its cash burn. When TNG last reported its balance sheet in December 2021, it had zero debt and cash worth AU$17m. Looking at the last year, the company burnt through AU$13m. Therefore, from December 2021 it had roughly 15 months of cash runway. While that cash runway isn't too concerning, sensible holders would be peering into the distance, and considering what happens if the company runs out of cash. Importantly, if we extrapolate recent cash burn trends, the cash runway would be a lot longer. Depicted below, you can see how its cash holdings have changed over time.
How Is TNG's Cash Burn Changing Over Time?
While TNG did record statutory revenue of AU$1.0k over the last year, it didn't have any revenue from operations. That means we consider it a pre-revenue business, and we will focus our growth analysis on cash burn, for now. With cash burn dropping by 14% it seems management feel the company is spending enough to advance its business plans at an appropriate pace. TNG makes us a little nervous due to its lack of substantial operating revenue. So we'd generally prefer stocks from this list of stocks that have analysts forecasting growth.
Can TNG Raise More Cash Easily?
Even though it has reduced its cash burn recently, shareholders should still consider how easy it would be for TNG to raise more cash in the future. Companies can raise capital through either debt or equity. Commonly, a business will sell new shares in itself to raise cash and drive growth. By comparing a company's annual cash burn to its total market capitalisation, we can estimate roughly how many shares it would have to issue in order to run the company for another year (at the same burn rate).
TNG has a market capitalisation of AU$97m and burnt through AU$13m last year, which is 14% of the company's market value. As a result, we'd venture that the company could raise more cash for growth without much trouble, albeit at the cost of some dilution.
Is TNG's Cash Burn A Worry?
The good news is that in our view TNG's cash burn situation gives shareholders real reason for optimism. Not only was its cash burn reduction quite good, but its cash burn relative to its market cap was a real positive. We don't think its cash burn is particularly problematic, but after considering the range of factors in this article, we do think shareholders should be monitoring how it changes over time. On another note, we conducted an in-depth investigation of the company, and identified 4 warning signs for TNG (1 is potentially serious!) that you should be aware of before investing here.
Of course TNG may not be the best stock to buy. So you may wish to see this free collection of companies boasting high return on equity, or this list of stocks that insiders are buying.
Have feedback on this article? Concerned about the content? Get in touch with us directly. Alternatively, email editorial-team (at) simplywallst.com.
This article by Simply Wall St is general in nature. We provide commentary based on historical data and analyst forecasts only using an unbiased methodology and our articles are not intended to be financial advice. It does not constitute a recommendation to buy or sell any stock, and does not take account of your objectives, or your financial situation. We aim to bring you long-term focused analysis driven by fundamental data. Note that our analysis may not factor in the latest price-sensitive company announcements or qualitative material. Simply Wall St has no position in any stocks mentioned.
