
 Yahoo Finance
 We're Keeping An Eye On Mount Ridley Mines's (ASX:MRD) Cash Burn Rate

Even when a business is losing money, it's possible for shareholders to make money if they buy a good business at the right price. For example, although Amazon.com made losses for many years after listing, if you had bought and held the shares since 1999, you would have made a fortune. But while history lauds those rare successes, those that fail are often forgotten; who remembers Pets.com?
So, the natural question for Mount Ridley Mines (ASX:MRD) shareholders is whether they should be concerned by its rate of cash burn. For the purpose of this article, we'll define cash burn as the amount of cash the company is spending each year to fund its growth (also called its negative free cash flow). We'll start by comparing its cash burn with its cash reserves in order to calculate its cash runway.
View our latest analysis for Mount Ridley Mines
How Long Is Mount Ridley Mines's Cash Runway?
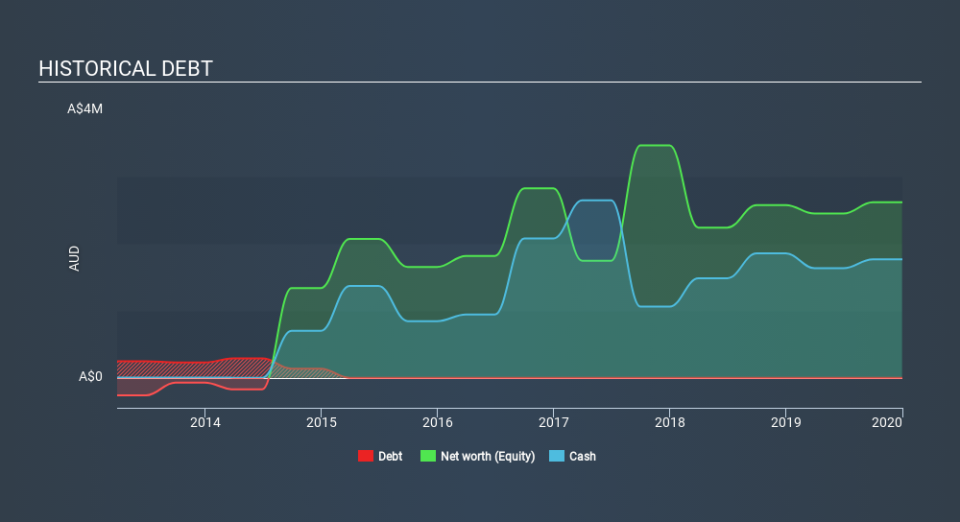
A company's cash runway is the amount of time it would take to burn through its cash reserves at its current cash burn rate. As at December 2019, Mount Ridley Mines had cash of AU$1.8m and no debt. In the last year, its cash burn was AU$882k. That means it had a cash runway of about 2.0 years as of December 2019. Arguably, that's a prudent and sensible length of runway to have. Depicted below, you can see how its cash holdings have changed over time.
How Is Mount Ridley Mines's Cash Burn Changing Over Time?
Whilst it's great to see that Mount Ridley Mines has already begun generating revenue from operations, last year it only produced AU$103k, so we don't think it is generating significant revenue, at this point. Therefore, for the purposes of this analysis we'll focus on how the cash burn is tracking. Its cash burn positively exploded in the last year, up 356%. With that kind of spending growth its cash runway will shorten quickly, as it simultaneously uses its cash while increasing the burn rate. Admittedly, we're a bit cautious of Mount Ridley Mines due to its lack of significant operating revenues. We prefer most of the stocks on this list of stocks that analysts expect to grow.
How Hard Would It Be For Mount Ridley Mines To Raise More Cash For Growth?
While Mount Ridley Mines does have a solid cash runway, its cash burn trajectory may have some shareholders thinking ahead to when the company may need to raise more cash. Companies can raise capital through either debt or equity. Commonly, a business will sell new shares in itself to raise cash to drive growth. We can compare a company's cash burn to its market capitalisation to get a sense for how many new shares a company would have to issue to fund one year's operations.
Mount Ridley Mines's cash burn of AU$882k is about 33% of its AU$2.7m market capitalisation. That's fairly notable cash burn, so if the company had to sell shares to cover the cost of another year's operations, shareholders would suffer some costly dilution.
So, Should We Worry About Mount Ridley Mines's Cash Burn?
On this analysis of Mount Ridley Mines's cash burn, we think its cash runway was reassuring, while its increasing cash burn has us a bit worried. We don't think its cash burn is particularly problematic, but after considering the range of factors in this article, we do think shareholders should be monitoring how it changes over time. Taking a deeper dive, we've spotted 5 warning signs for Mount Ridley Mines you should be aware of, and 2 of them are potentially serious.
If you would prefer to check out another company with better fundamentals, then do not miss this free list of interesting companies, that have HIGH return on equity and low debt or this list of stocks which are all forecast to grow.
If you spot an error that warrants correction, please contact the editor at editorial-team@simplywallst.com. This article by Simply Wall St is general in nature. It does not constitute a recommendation to buy or sell any stock, and does not take account of your objectives, or your financial situation. Simply Wall St has no position in the stocks mentioned.
We aim to bring you long-term focused research analysis driven by fundamental data. Note that our analysis may not factor in the latest price-sensitive company announcements or qualitative material. Thank you for reading.
