
 Yahoo Finance
 We're Keeping An Eye On IperionX's (ASX:IPX) Cash Burn Rate
Just because a business does not make any money, does not mean that the stock will go down. For example, biotech and mining exploration companies often lose money for years before finding success with a new treatment or mineral discovery. But the harsh reality is that very many loss making companies burn through all their cash and go bankrupt.
Given this risk, we thought we'd take a look at whether IperionX (ASX:IPX) shareholders should be worried about its cash burn. For the purposes of this article, cash burn is the annual rate at which an unprofitable company spends cash to fund its growth; its negative free cash flow. The first step is to compare its cash burn with its cash reserves, to give us its 'cash runway'.
View our latest analysis for IperionX
How Long Is IperionX's Cash Runway?
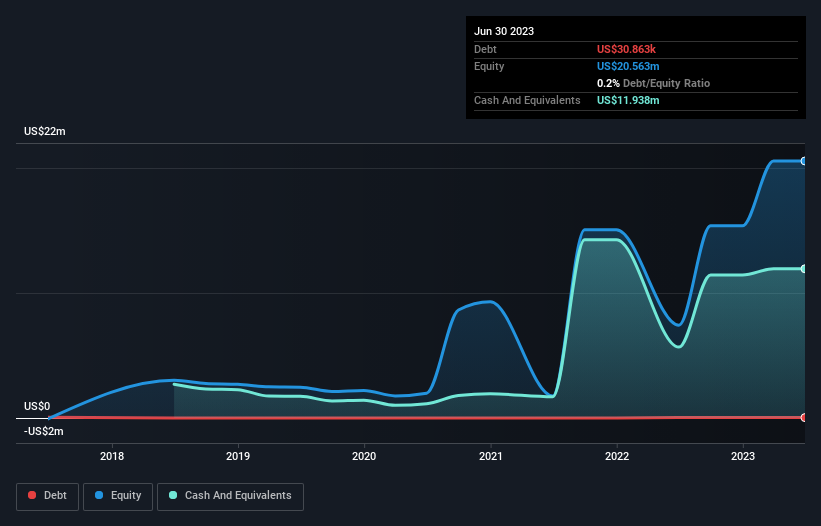
A company's cash runway is the amount of time it would take to burn through its cash reserves at its current cash burn rate. As at June 2023, IperionX had cash of US$12m and such minimal debt that we can ignore it for the purposes of this analysis. Importantly, its cash burn was US$19m over the trailing twelve months. So it had a cash runway of approximately 8 months from June 2023. That's quite a short cash runway, indicating the company must either reduce its annual cash burn or replenish its cash. You can see how its cash balance has changed over time in the image below.
How Is IperionX's Cash Burn Changing Over Time?
Because IperionX isn't currently generating revenue, we consider it an early-stage business. Nonetheless, we can still examine its cash burn trajectory as part of our assessment of its cash burn situation. Over the last year its cash burn actually increased by 24%, which suggests that management are increasing investment in future growth, but not too quickly. However, the company's true cash runway will therefore be shorter than suggested above, if spending continues to increase. While the past is always worth studying, it is the future that matters most of all. For that reason, it makes a lot of sense to take a look at our analyst forecasts for the company.
How Hard Would It Be For IperionX To Raise More Cash For Growth?
Since its cash burn is moving in the wrong direction, IperionX shareholders may wish to think ahead to when the company may need to raise more cash. Companies can raise capital through either debt or equity. One of the main advantages held by publicly listed companies is that they can sell shares to investors to raise cash and fund growth. By comparing a company's annual cash burn to its total market capitalisation, we can estimate roughly how many shares it would have to issue in order to run the company for another year (at the same burn rate).
Since it has a market capitalisation of US$187m, IperionX's US$19m in cash burn equates to about 9.9% of its market value. Given that is a rather small percentage, it would probably be really easy for the company to fund another year's growth by issuing some new shares to investors, or even by taking out a loan.
Is IperionX's Cash Burn A Worry?
On this analysis of IperionX's cash burn, we think its cash burn relative to its market cap was reassuring, while its cash runway has us a bit worried. Summing up, we think the IperionX's cash burn is a risk, based on the factors we mentioned in this article. On another note, IperionX has 4 warning signs (and 3 which don't sit too well with us) we think you should know about.
Of course, you might find a fantastic investment by looking elsewhere. So take a peek at this free list of interesting companies, and this list of stocks growth stocks (according to analyst forecasts)
Have feedback on this article? Concerned about the content? Get in touch with us directly. Alternatively, email editorial-team (at) simplywallst.com.
This article by Simply Wall St is general in nature. We provide commentary based on historical data and analyst forecasts only using an unbiased methodology and our articles are not intended to be financial advice. It does not constitute a recommendation to buy or sell any stock, and does not take account of your objectives, or your financial situation. We aim to bring you long-term focused analysis driven by fundamental data. Note that our analysis may not factor in the latest price-sensitive company announcements or qualitative material. Simply Wall St has no position in any stocks mentioned.
