
 Yahoo Finance
 We're Keeping An Eye On Cyngn's (NASDAQ:CYN) Cash Burn Rate
We can readily understand why investors are attracted to unprofitable companies. For example, although software-as-a-service business Salesforce.com lost money for years while it grew recurring revenue, if you held shares since 2005, you'd have done very well indeed. But while the successes are well known, investors should not ignore the very many unprofitable companies that simply burn through all their cash and collapse.
Given this risk, we thought we'd take a look at whether Cyngn (NASDAQ:CYN) shareholders should be worried about its cash burn. For the purpose of this article, we'll define cash burn as the amount of cash the company is spending each year to fund its growth (also called its negative free cash flow). Let's start with an examination of the business' cash, relative to its cash burn.
View our latest analysis for Cyngn
Does Cyngn Have A Long Cash Runway?
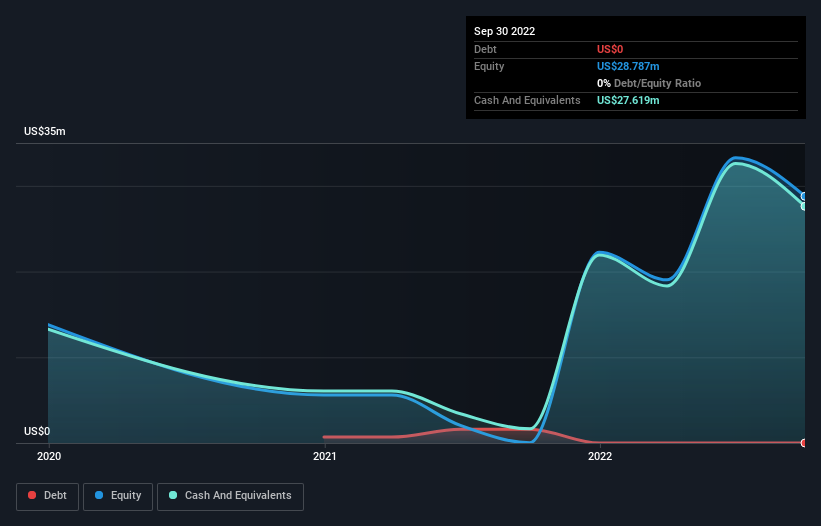
A cash runway is defined as the length of time it would take a company to run out of money if it kept spending at its current rate of cash burn. As at September 2022, Cyngn had cash of US$28m and no debt. In the last year, its cash burn was US$16m. That means it had a cash runway of around 21 months as of September 2022. That's not too bad, but it's fair to say the end of the cash runway is in sight, unless cash burn reduces drastically. You can see how its cash balance has changed over time in the image below.
How Is Cyngn's Cash Burn Changing Over Time?
Cyngn didn't record any revenue over the last year, indicating that it's an early stage company still developing its business. So while we can't look to sales to understand growth, we can look at how the cash burn is changing to understand how expenditure is trending over time. In fact, it ramped its spending strongly over the last year, increasing cash burn by 103%. That sort of spending growth rate can't continue for very long before it causes balance sheet weakness, generally speaking. While the past is always worth studying, it is the future that matters most of all. For that reason, it makes a lot of sense to take a look at our analyst forecasts for the company.
How Hard Would It Be For Cyngn To Raise More Cash For Growth?
While Cyngn does have a solid cash runway, its cash burn trajectory may have some shareholders thinking ahead to when the company may need to raise more cash. Issuing new shares, or taking on debt, are the most common ways for a listed company to raise more money for its business. Many companies end up issuing new shares to fund future growth. By looking at a company's cash burn relative to its market capitalisation, we gain insight on how much shareholders would be diluted if the company needed to raise enough cash to cover another year's cash burn.
Cyngn's cash burn of US$16m is about 43% of its US$36m market capitalisation. That's high expenditure relative to the value of the entire company, so if it does have to issue shares to fund more growth, that could end up really hurting shareholders returns (through significant dilution).
Is Cyngn's Cash Burn A Worry?
On this analysis of Cyngn's cash burn, we think its cash runway was reassuring, while its increasing cash burn has us a bit worried. Looking at the factors mentioned in this short report, we do think that its cash burn is a bit risky, and it does make us slightly nervous about the stock. Separately, we looked at different risks affecting the company and spotted 6 warning signs for Cyngn (of which 2 make us uncomfortable!) you should know about.
Of course, you might find a fantastic investment by looking elsewhere. So take a peek at this free list of companies insiders are buying, and this list of stocks growth stocks (according to analyst forecasts)
Have feedback on this article? Concerned about the content? Get in touch with us directly. Alternatively, email editorial-team (at) simplywallst.com.
This article by Simply Wall St is general in nature. We provide commentary based on historical data and analyst forecasts only using an unbiased methodology and our articles are not intended to be financial advice. It does not constitute a recommendation to buy or sell any stock, and does not take account of your objectives, or your financial situation. We aim to bring you long-term focused analysis driven by fundamental data. Note that our analysis may not factor in the latest price-sensitive company announcements or qualitative material. Simply Wall St has no position in any stocks mentioned.
Join A Paid User Research Session
You’ll receive a US$30 Amazon Gift card for 1 hour of your time while helping us build better investing tools for the individual investors like yourself. Sign up here
